Home › Cape Cod
Cape Cod: healthy on paper, tight under the tax cap
On paper Cape Cod looks healthy: all 15 towns grade A to C and 13 hold more reserves than the median town. Much of that is flattered by second homes (13% to 68% of housing is seasonal), which lift property values and keep tax rates low.
But 8 of 15 have less room under the tax cap than the median town, 4 Outer Cape towns are among the state's 7 most frequent override voters, and Outer Cape bills are rising fastest: Provincetown 8.4% a year, Eastham 7.0%, Orleans 6.5% (median town 4.0%).
Barnstable spotlight
Reserves (free cash, % of budget)
BarnstableMedian MA town
Unused room under the tax cap (% of max levy)
BarnstableMedian MA town
| Budget grade and override chance | A · Excellent (better than 96% of MA towns), score 96.9; override chance Medium (3 points, all from tax cap room) |
|---|---|
| Ability to pay | Ability to pay: above the state median for income; second homes inflate property value here (income per resident $56,079) |
| Reserves | 15.4% of budget in FY2026, about double the median town (11.4% certified for FY2027) |
| Room under the tax cap | 0.14% of max levy in FY2026 ($226,595 on a $156M levy); under 0.5% in 14 of the last 15 years |
| Override votes | None since 2003, when the last one failed |
| Next vote | 4 May 2027: $321M wastewater debt exclusion. Town estimate: about $200 a year at peak for a median home with the residential exemption |
| Tax bill | Average single-family bill $5,599 in FY2026 (town tax only); 30% residential exemption for year-round owners |
| Not included | Village fire district taxes, $1.15 to $2.81 per $1,000 depending on the village |
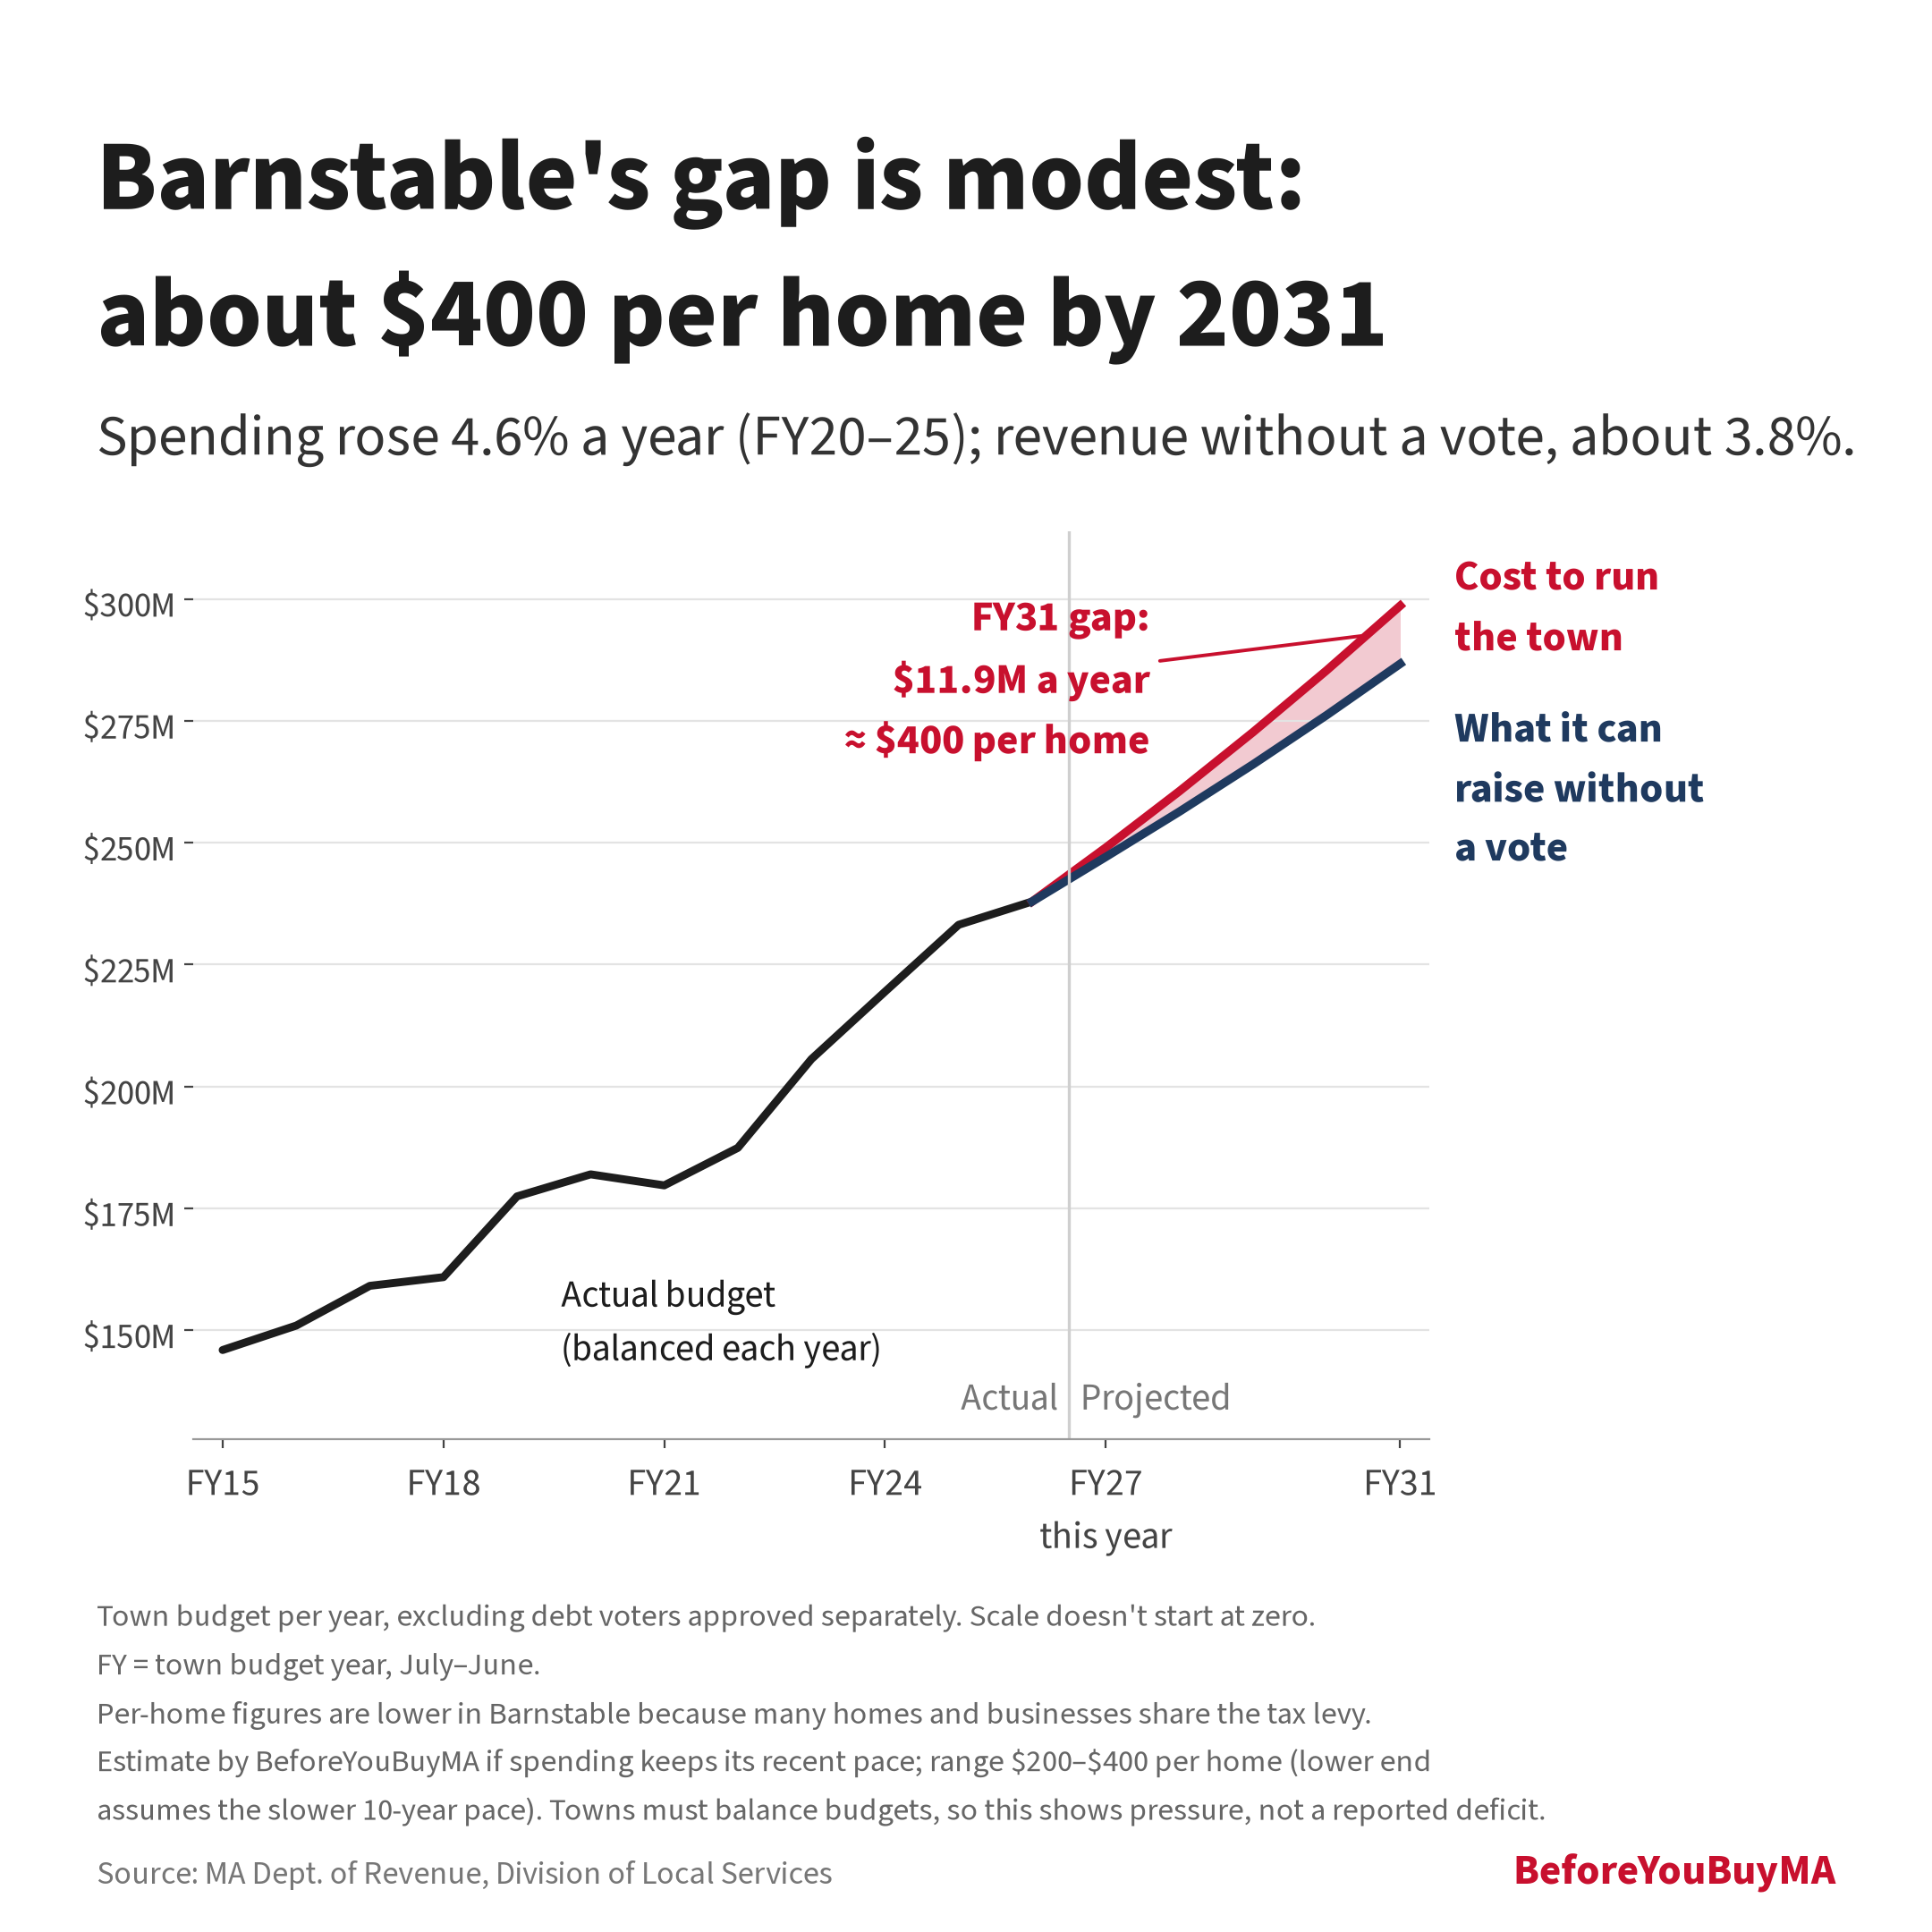
Barnstable's gap is modest: about $400 per home by 2031
All 15 Cape towns
DLS has no average bill for Barnstable or Provincetown before FY2022.
Budget grade and override chance
| Town | Pop. | Budget grade (score) | Override chance (points) | Override votes since Jul 2016 (questions passed/total) | Room under cap FY26 | Reserves FY24-26 avg |
|---|---|---|---|---|---|---|
| Barnstable | 49.5k | A · Excellent 96.9 | Medium 3 | none | 0.14% | 15.0% |
| Falmouth | 33.1k | A · Excellent 95.4 | High 5 | 2 (2/2) | 1.06% | 12.3% |
| Yarmouth | 25.2k | B · Solid 91.0 | High · routine 6 | 8 (8/8) | 0.09% | 10.4% |
| Bourne | 20.7k | B± · Solid 92.8 | Medium 4 | none | 0.10% | 11.3% |
| Sandwich | 20.6k | C · Fair 71.2 | Low 2 | none | 4.80% | 4.5% |
| Mashpee | 15.5k | A · Excellent 100.0 | High 5 | 2 (2/2) | 1.73% | 16.3% |
| Dennis | 14.9k | B · Solid 85.3 | High 6 | 1 (3/3) | 0.65% | 8.1% |
| Harwich | 13.6k | C · Fair 76.0 | Medium 4 | none | 0.24% | 5.3% |
| Brewster | 10.4k | B · Solid 84.5 | High · routine 7 | 4 (7/7) | 0.08% | 7.9% |
| Chatham | 6.7k | B · Solid 86.9 | Low 2 | none | 2.56% | 9.9% |
| Orleans | 6.4k | B · Solid 85.1 | High · routine 7 | 9 (17/17) | 0.12% | 9.3% |
| Eastham | 5.8k | B · Solid 87.6 | High · routine 7 | 6 (12/12) | 0.02% | 13.6% |
| Provincetown | 3.7k | B · Solid 83.0 | High · routine 6 | 6 (7/8) | 0.38% | 8.3% |
| Wellfleet | 3.6k | A · Excellent 98.0 | High · routine 5 | 9 (18/22) | 1.20% | 15.1% |
| Truro | 2.5k | A · Excellent 98.3 | High 6 | 5 (4/11) | 0.12% | 14.7% |
| Median MA town | 10.6k | 79.0 (B cutoff) | - | none (41% of towns held one) | 0.34% | 7.3% |
Taxes, homes, schools
| Town | Avg single-family bill FY26 | Bill growth / yr | Res. tax rate FY26 (exemption) | Median single-family price 2024 (5-yr) | Single-family sales 2024 | Seasonal homes | Enrollment 5-yr |
|---|---|---|---|---|---|---|---|
| Barnstable | $5,599 | 3.7% (FY22-26) | $6.80, 30% exemption | $672k (+68%) | 496 | 19% | -4% |
| Falmouth | $5,881 | 3.6% | $5.73 | $802k (+71%) | 382 | 28% | -6% |
| Yarmouth | $4,949 | 4.2% | $6.97 | $612k (+76%) | 313 | 29% | +7% (D-Y) |
| Bourne | $6,075 | 4.1% | $7.65 | $668k (+72%) | 169 | 17% | -7% |
| Sandwich | $7,818 | 4.0% | $10.19 | $740k (+82%) | 266 | 13% | -8% |
| Mashpee | $6,346 | 4.1% | $6.41, 20% exemption | $805k (+72%) | 221 | 30% | -7% |
| Dennis | $3,873 | 3.8% | $4.29 | $715k (+82%) | 250 | 52% | +7% (D-Y) |
| Harwich | $5,872 | 3.5% | $5.81 | $827k (+85%) | 184 | 34% | -6% (Monomoy) |
| Brewster | $6,544 | 5.2% | $6.77 | $878k (+86%) | 103 | 42% | -10% (Nauset 6-12 + local K-5) |
| Chatham | $6,381 | 4.2% | $3.67, none (35% from FY27) | $1,370k (+79%) | 129 | 54% | -6% (Monomoy) |
| Orleans | $8,969 | 6.5% | $6.11 | $1,210k (+82%) | 80 | 43% | -17% (Nauset 6-12 + local K-5) |
| Eastham | $6,664 | 7.0% | $7.71, 3% exemption | $800k (+68%) | 162 | 53% | -13% (Nauset 6-12 + local K-5) |
| Provincetown | $11,185 | 8.4% (FY22-26) | $6.13, 35% exemption | $2,030k (+106%) | 22 | 50% | +4% |
| Wellfleet | $7,384 | 6.3% | $7.10, 32.5% exemption | $925k (+67%) | 79 | 54% | -19% (Nauset 6-12 + local K-5) |
| Truro | $8,064 | 4.9% | $6.17, 35% exemption | $1,510k (+67%) | 36 | 68% | -34% (Truro K-6 only) |
| Median MA town | $6,755 | 4.0% | $12.44 | $614k (+53%) | - | 0.9% | -2% |
Cape Cod caveats
- Residential exemptions (Barnstable, Mashpee, Eastham, Provincetown, Wellfleet, Truro; Chatham from FY2027) shift tax to second homes, so the average bill misstates what a year-round owner pays.
- Tax bill as a share of income is unreliable here: many owners live elsewhere, so local income does not match who pays.
- Six Cape towns vote on overrides most years and pass 82-100% of questions (often for staff, firefighters or schools): Brewster, Eastham, Orleans, Provincetown, Wellfleet, Yarmouth. They show High · routine in amber: a vote is likely, but it signals habit, not distress.
- Points are unchanged: in back-tests, Cape towns rated High held an override vote 70% (as of 2020) and 88% (as of 2023) of the time, above the statewide High rate.
- Regional districts blur school figures: Nauset (grades 6-12, with town K-5 districts), Monomoy (Chatham, Harwich) and Dennis-Yarmouth.
- Small sale counts (Provincetown 22 and Truro 36 single-family sales in 2024) make median prices volatile.
15 Barnstable County towns. Budget grades and override chance from our score. Tax bills, rates and votes: DLS. Seasonal homes: Census ACS 2020-24. Enrollment: DESE. Built 25 Oct 2026.