Home › Is the budget underwater?
Is the budget underwater?
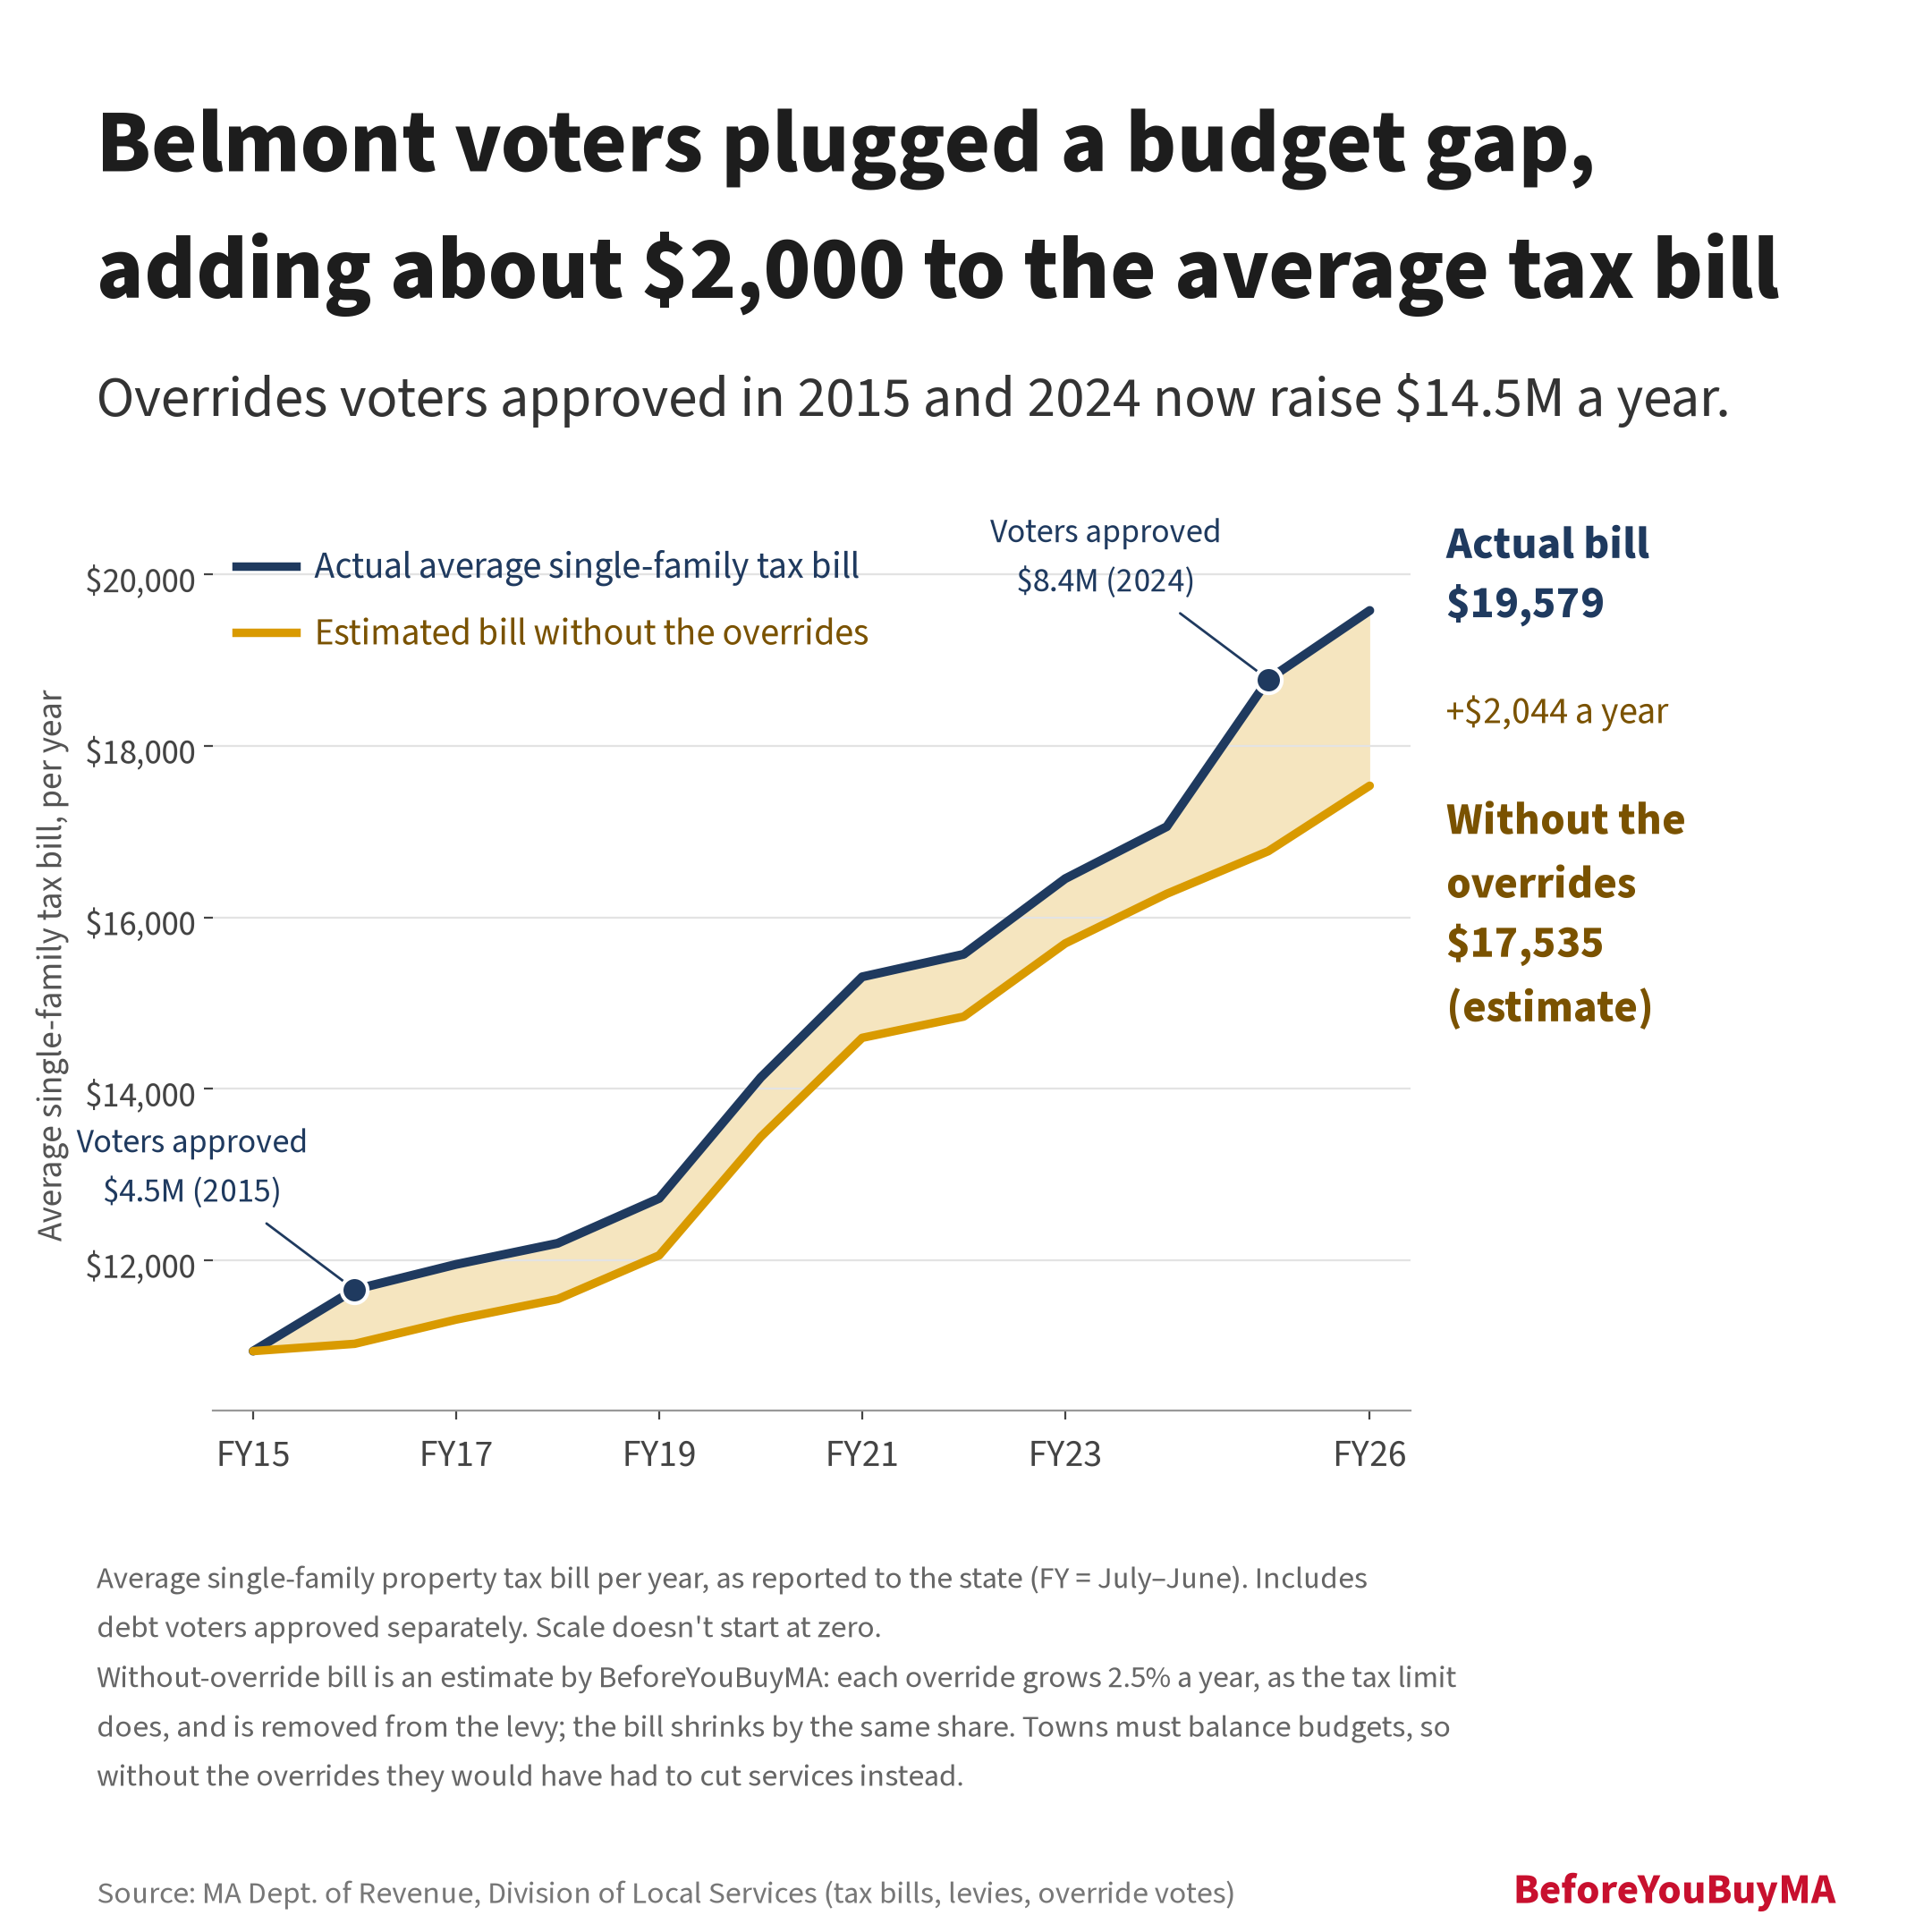
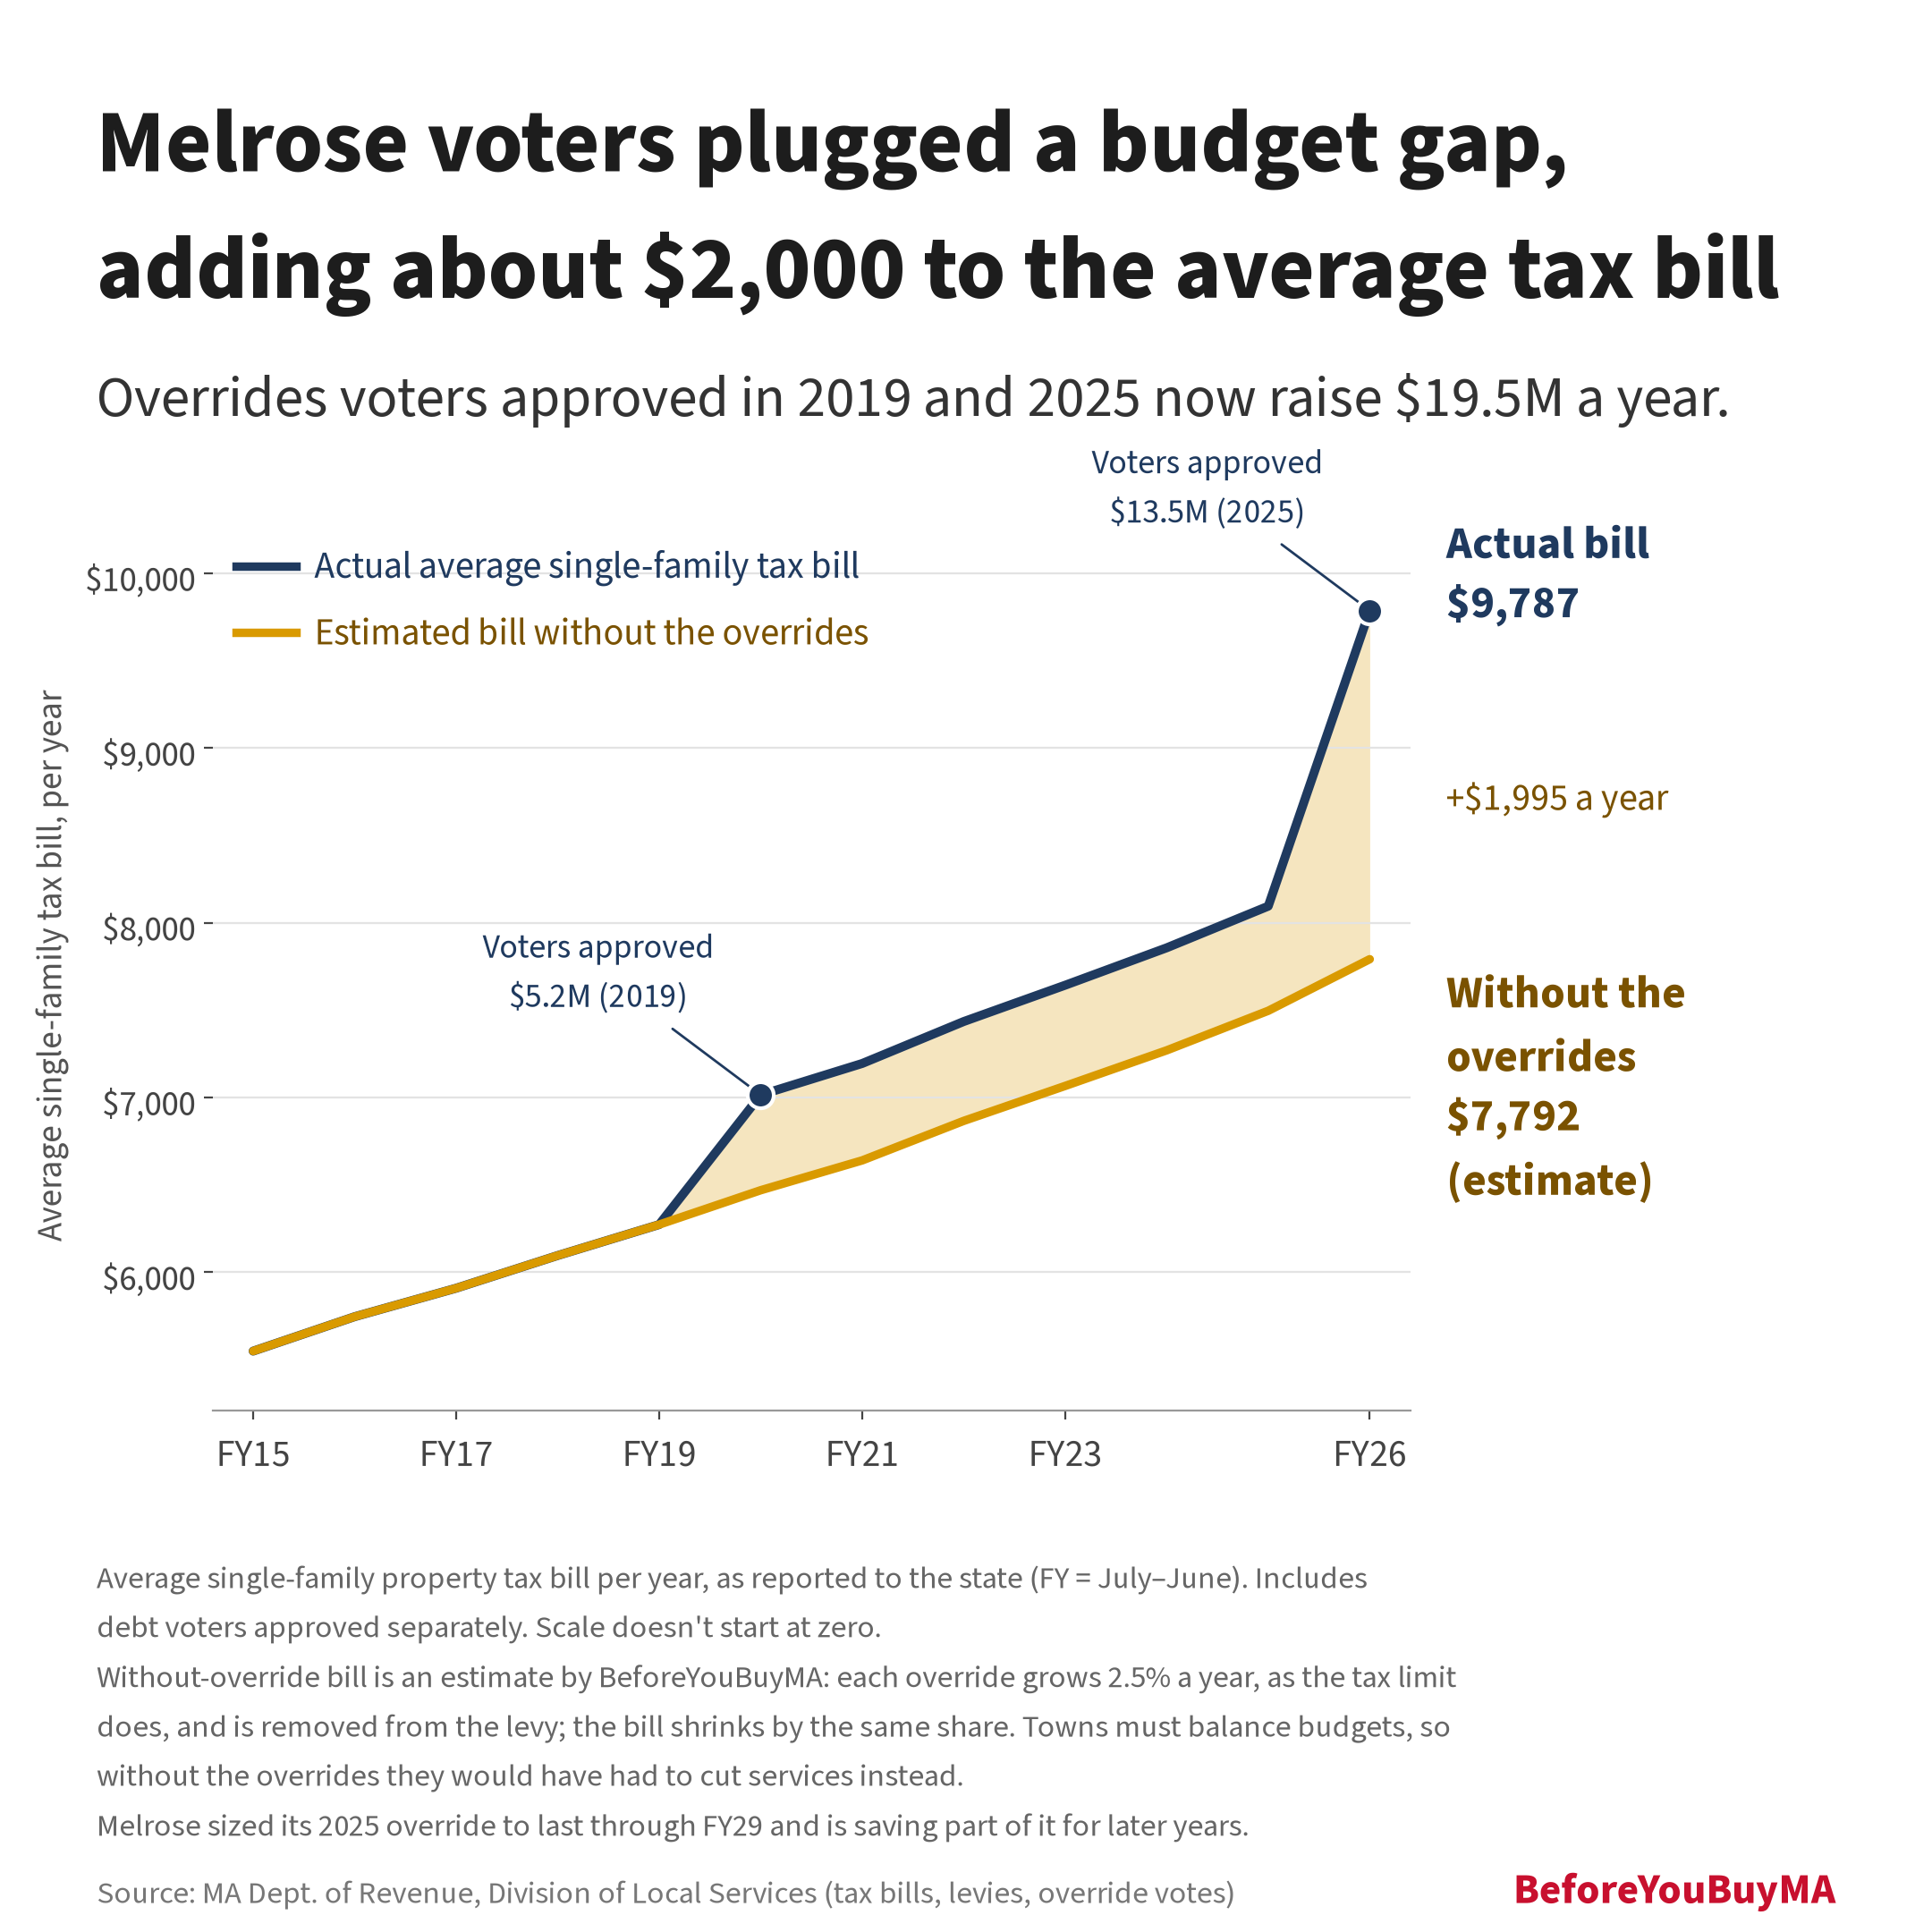
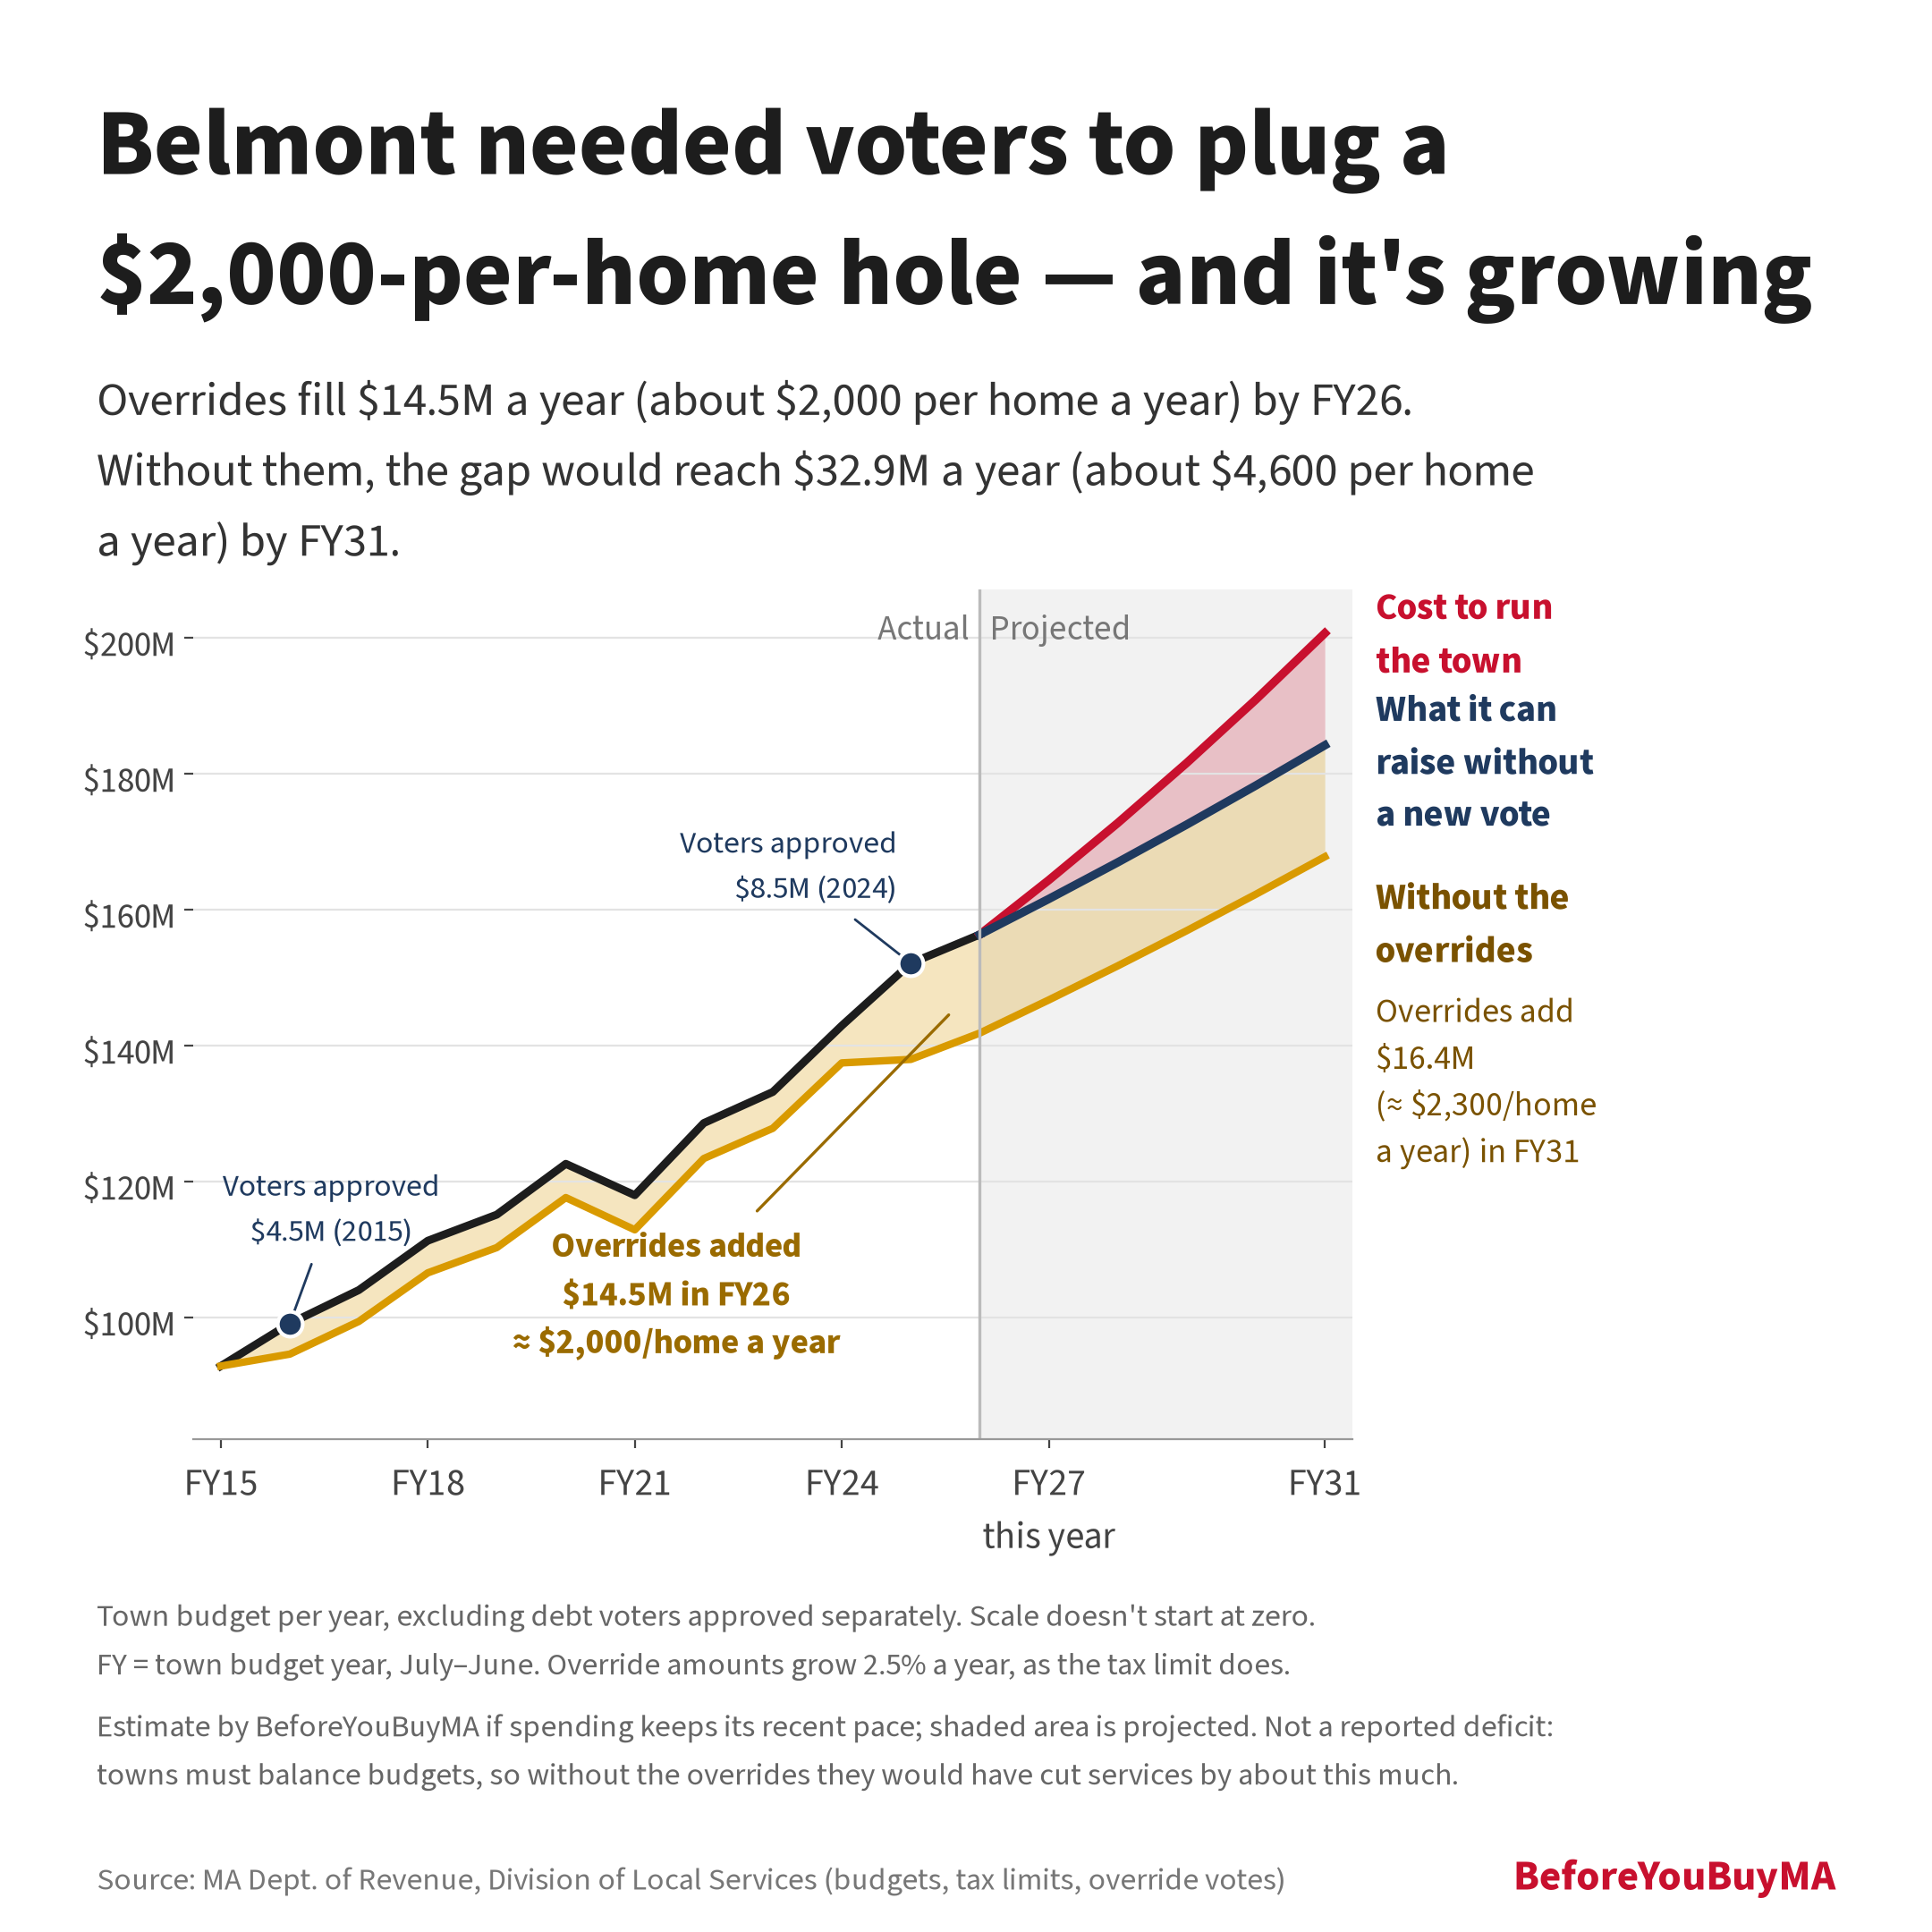
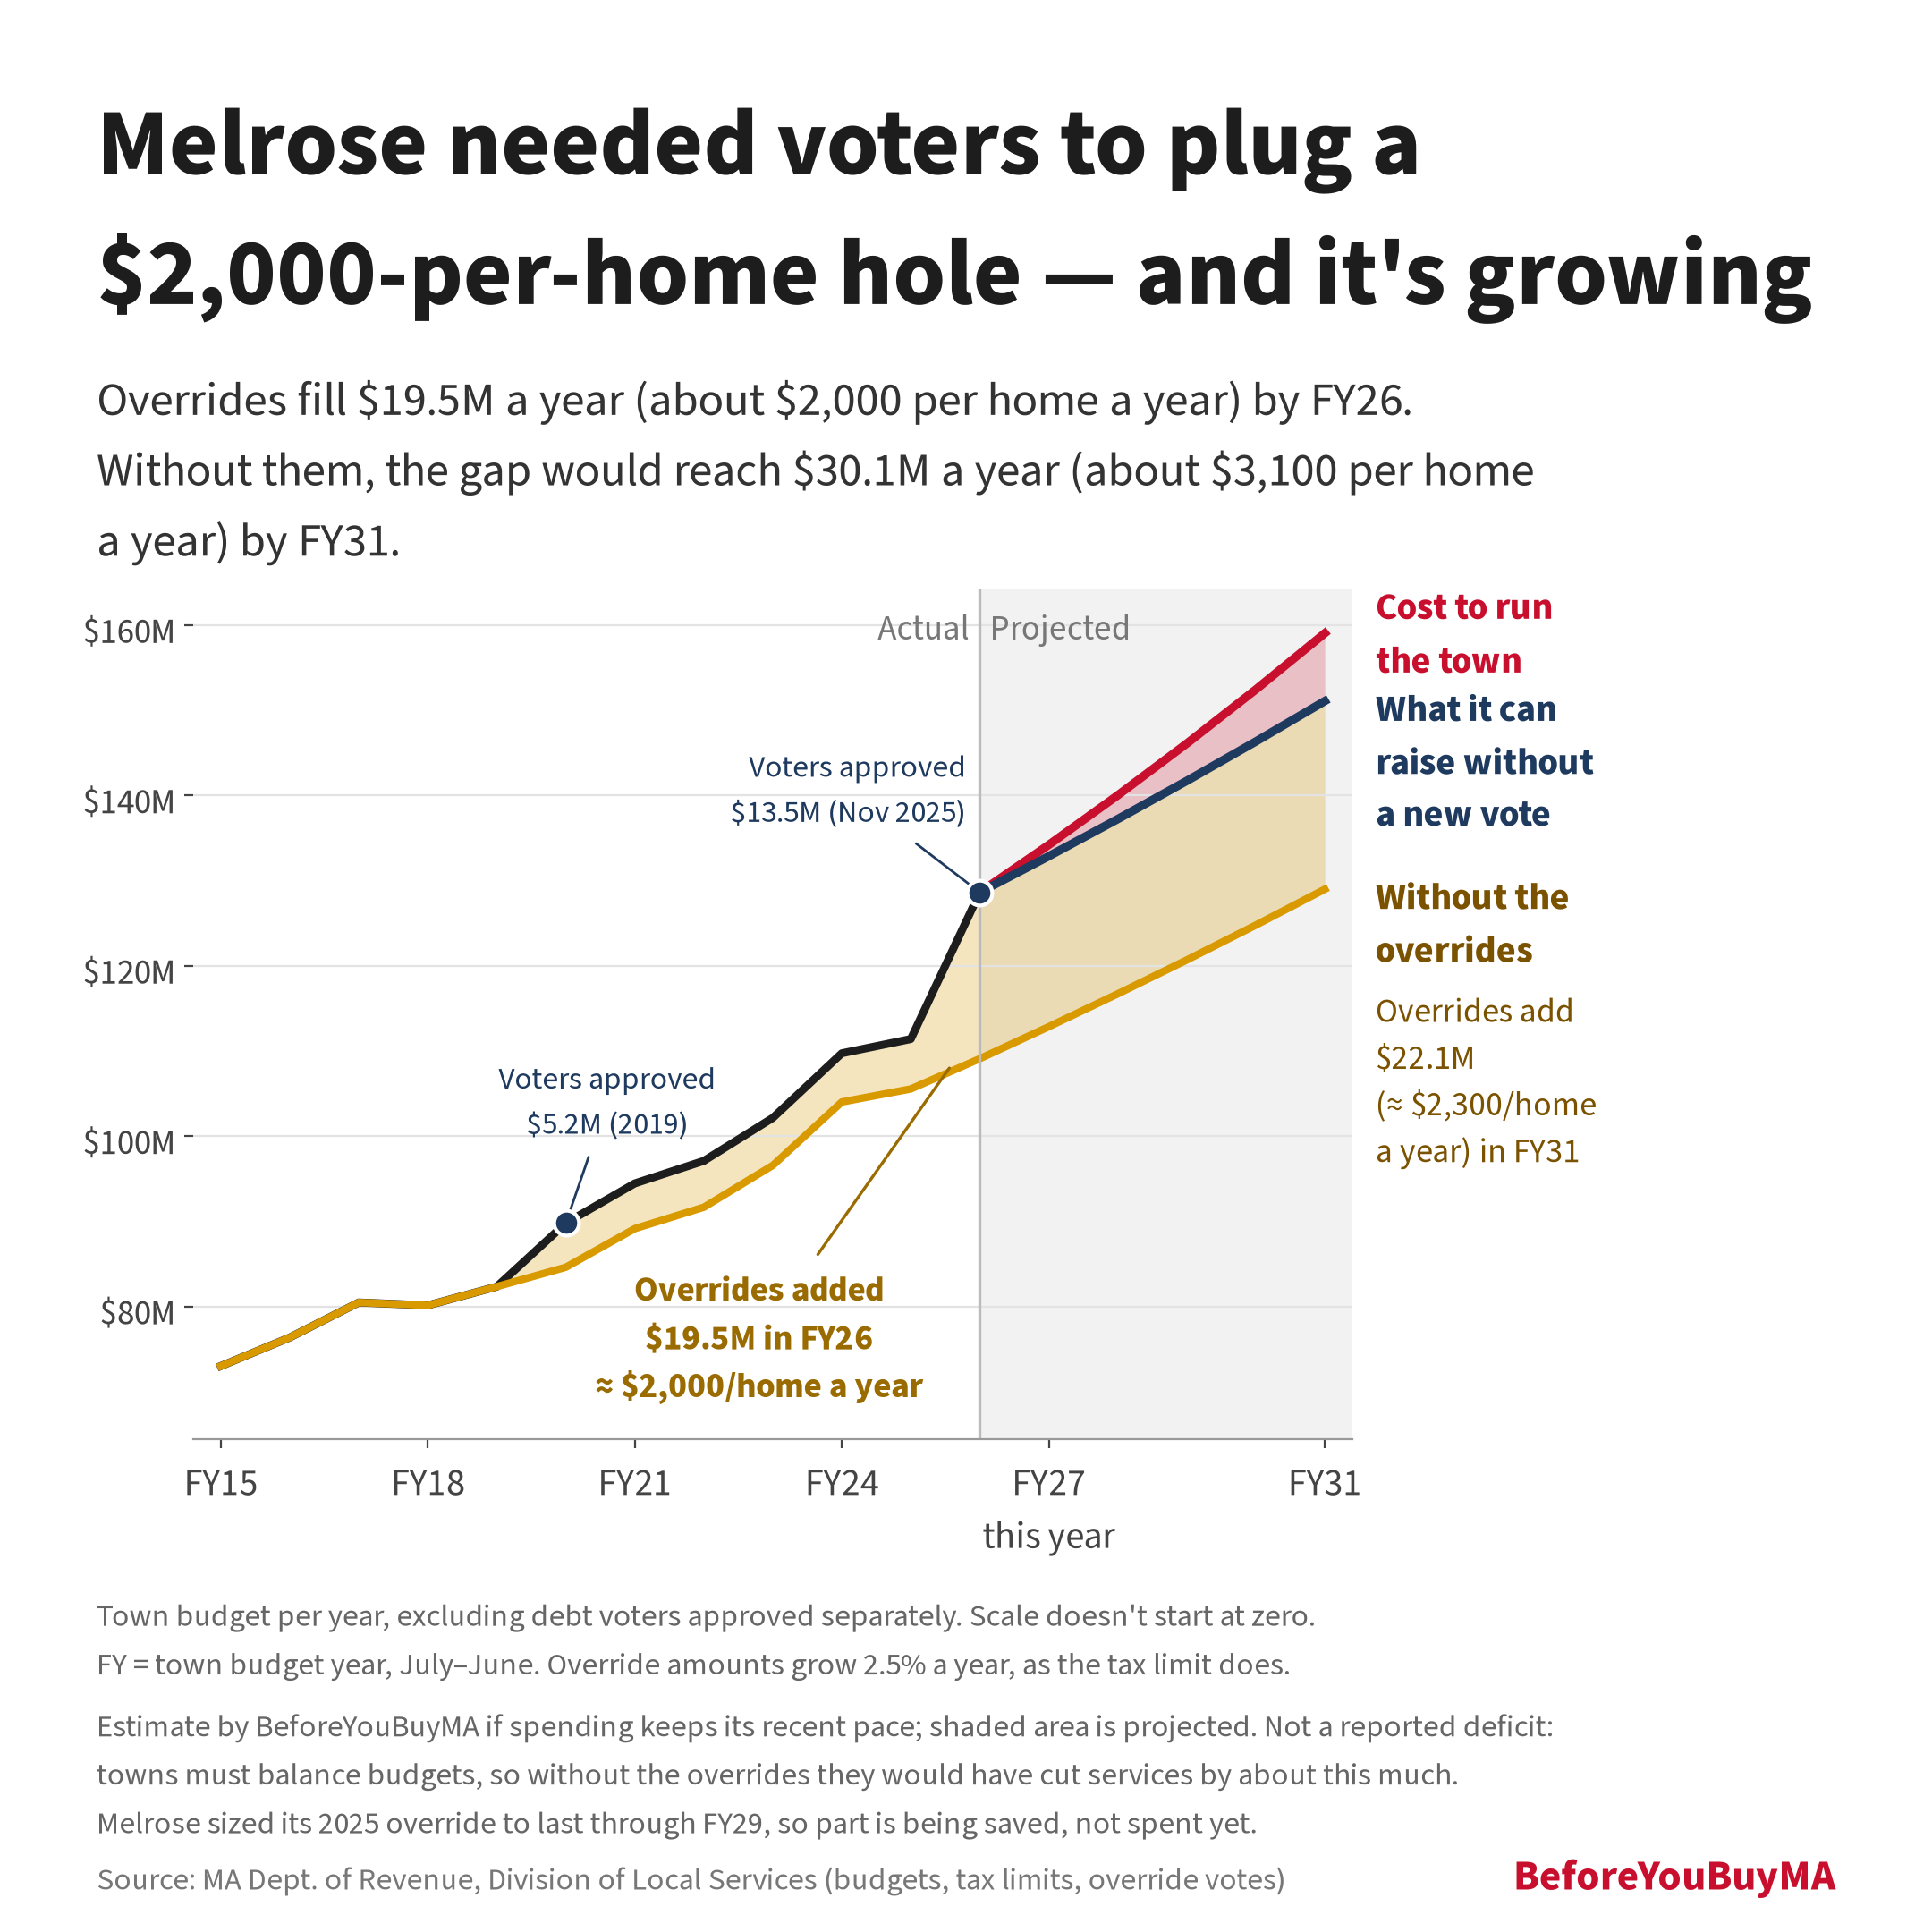
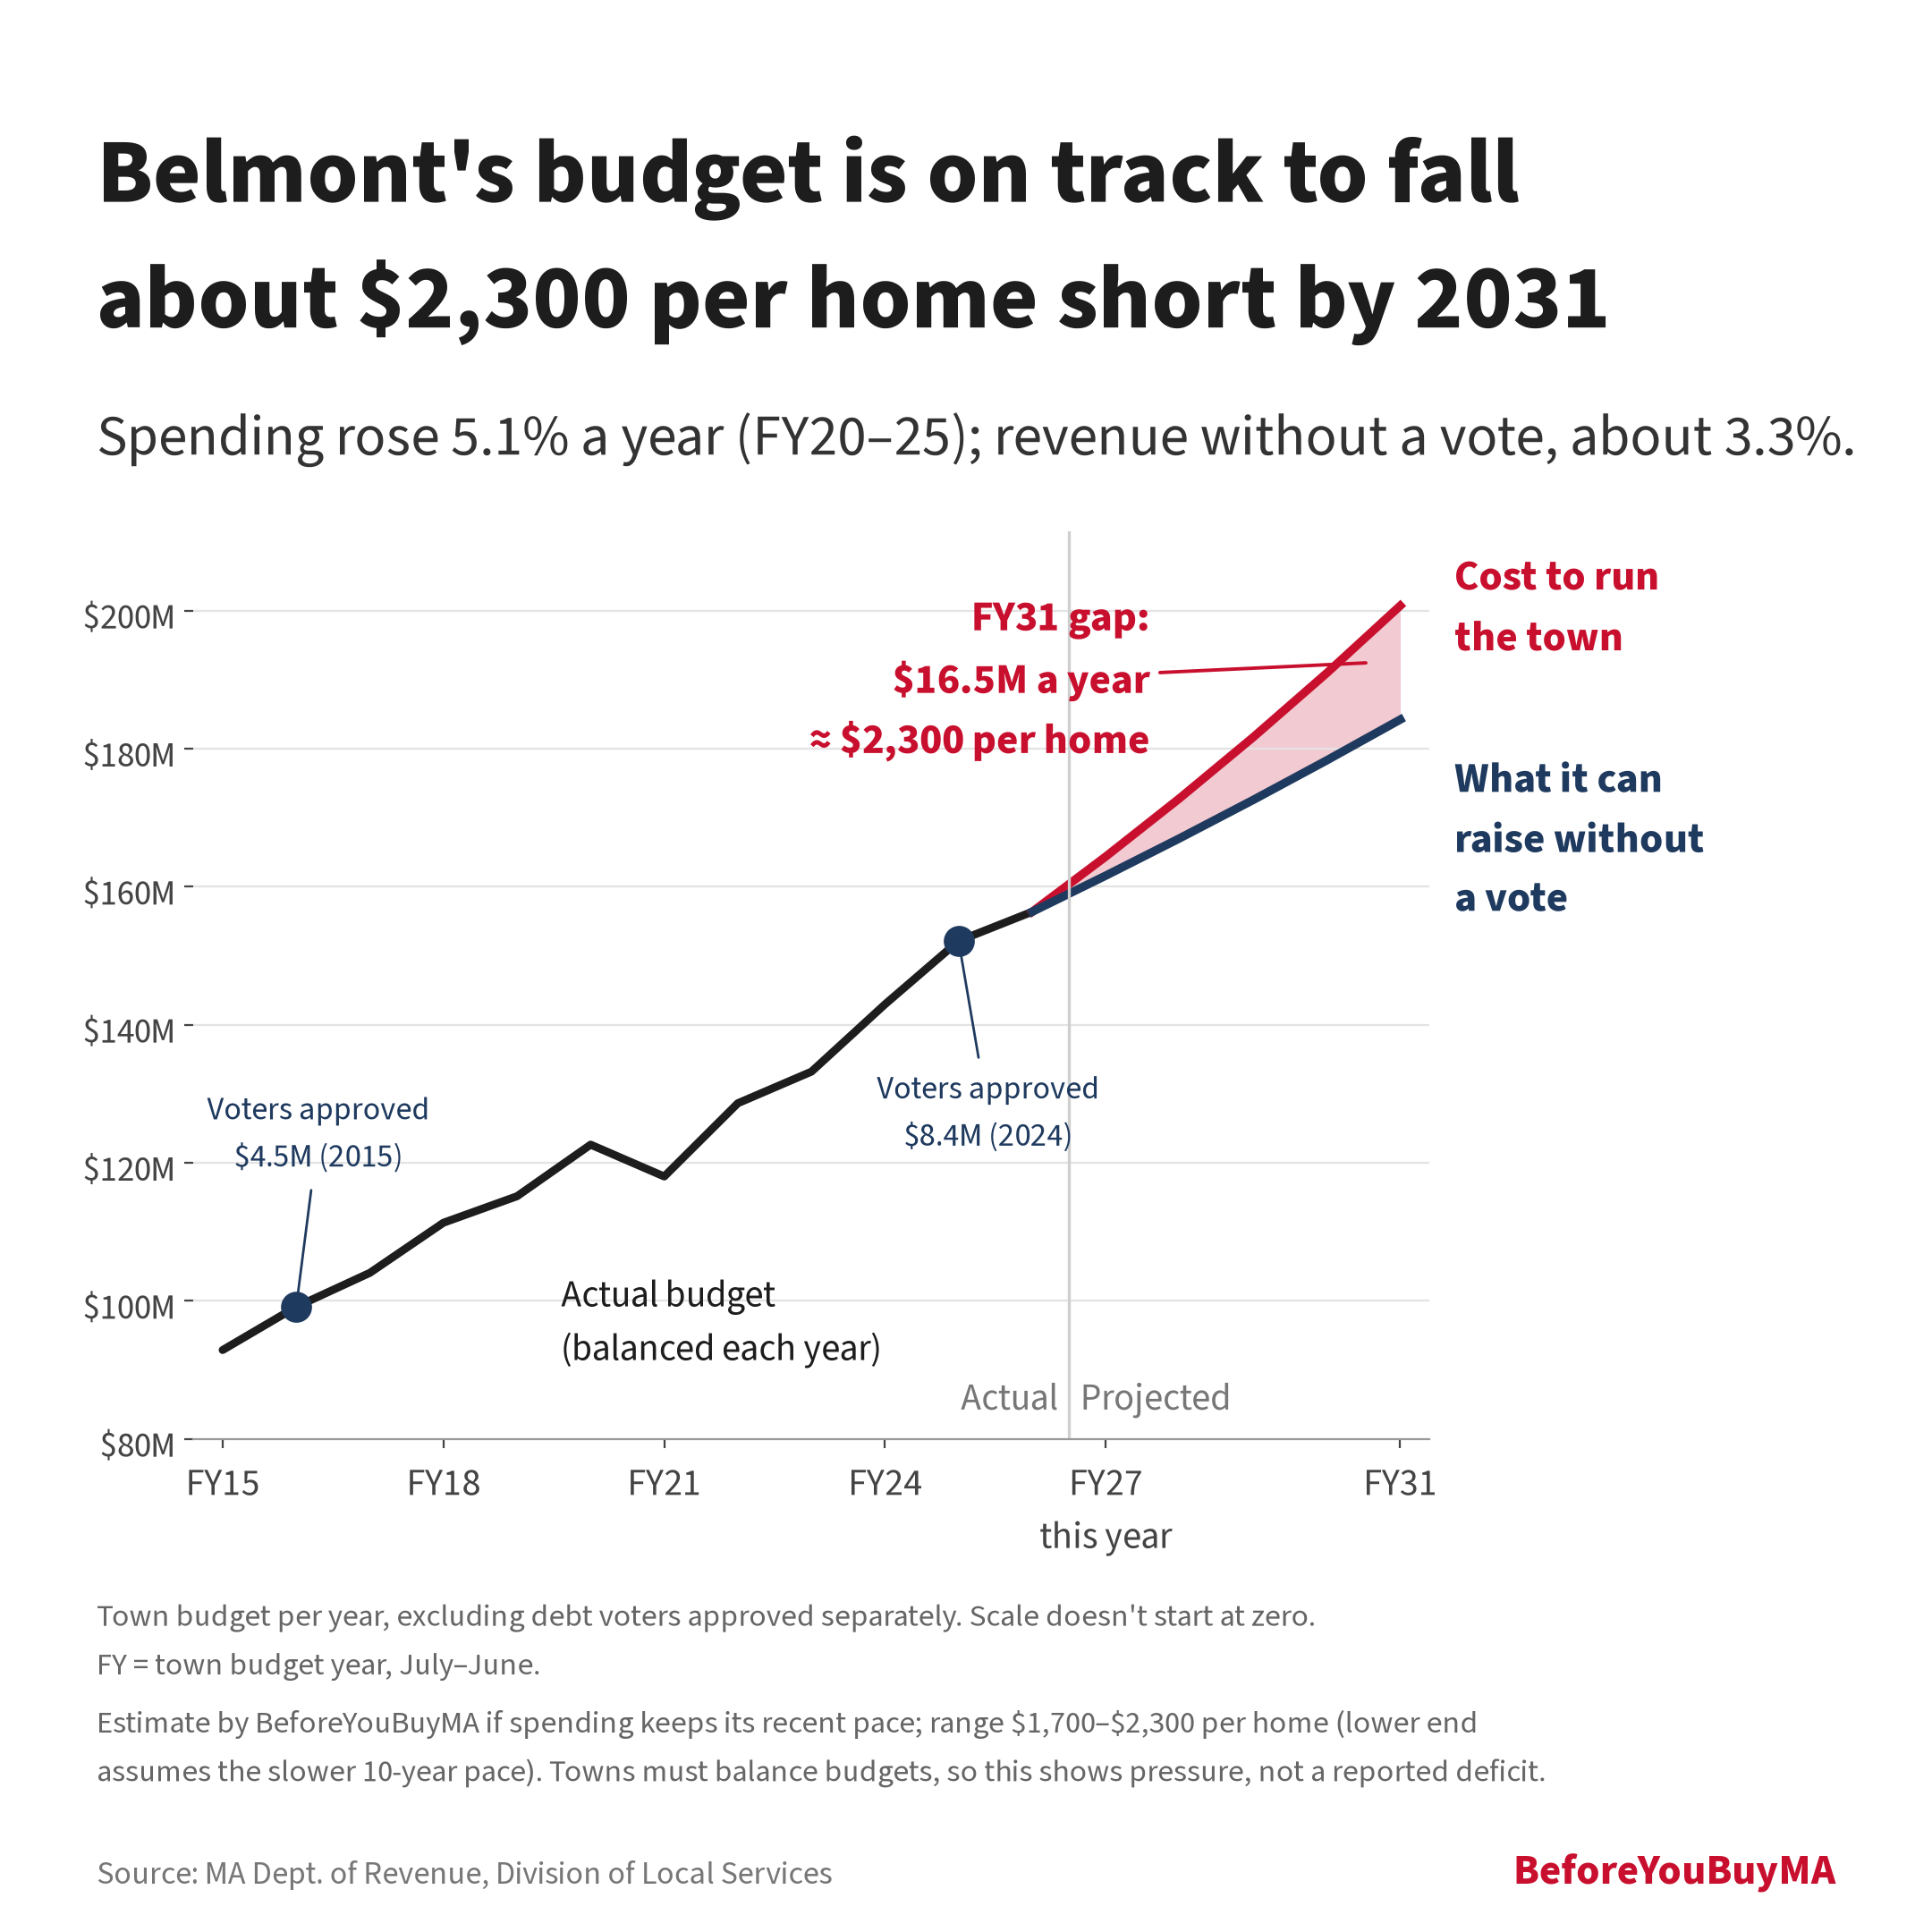
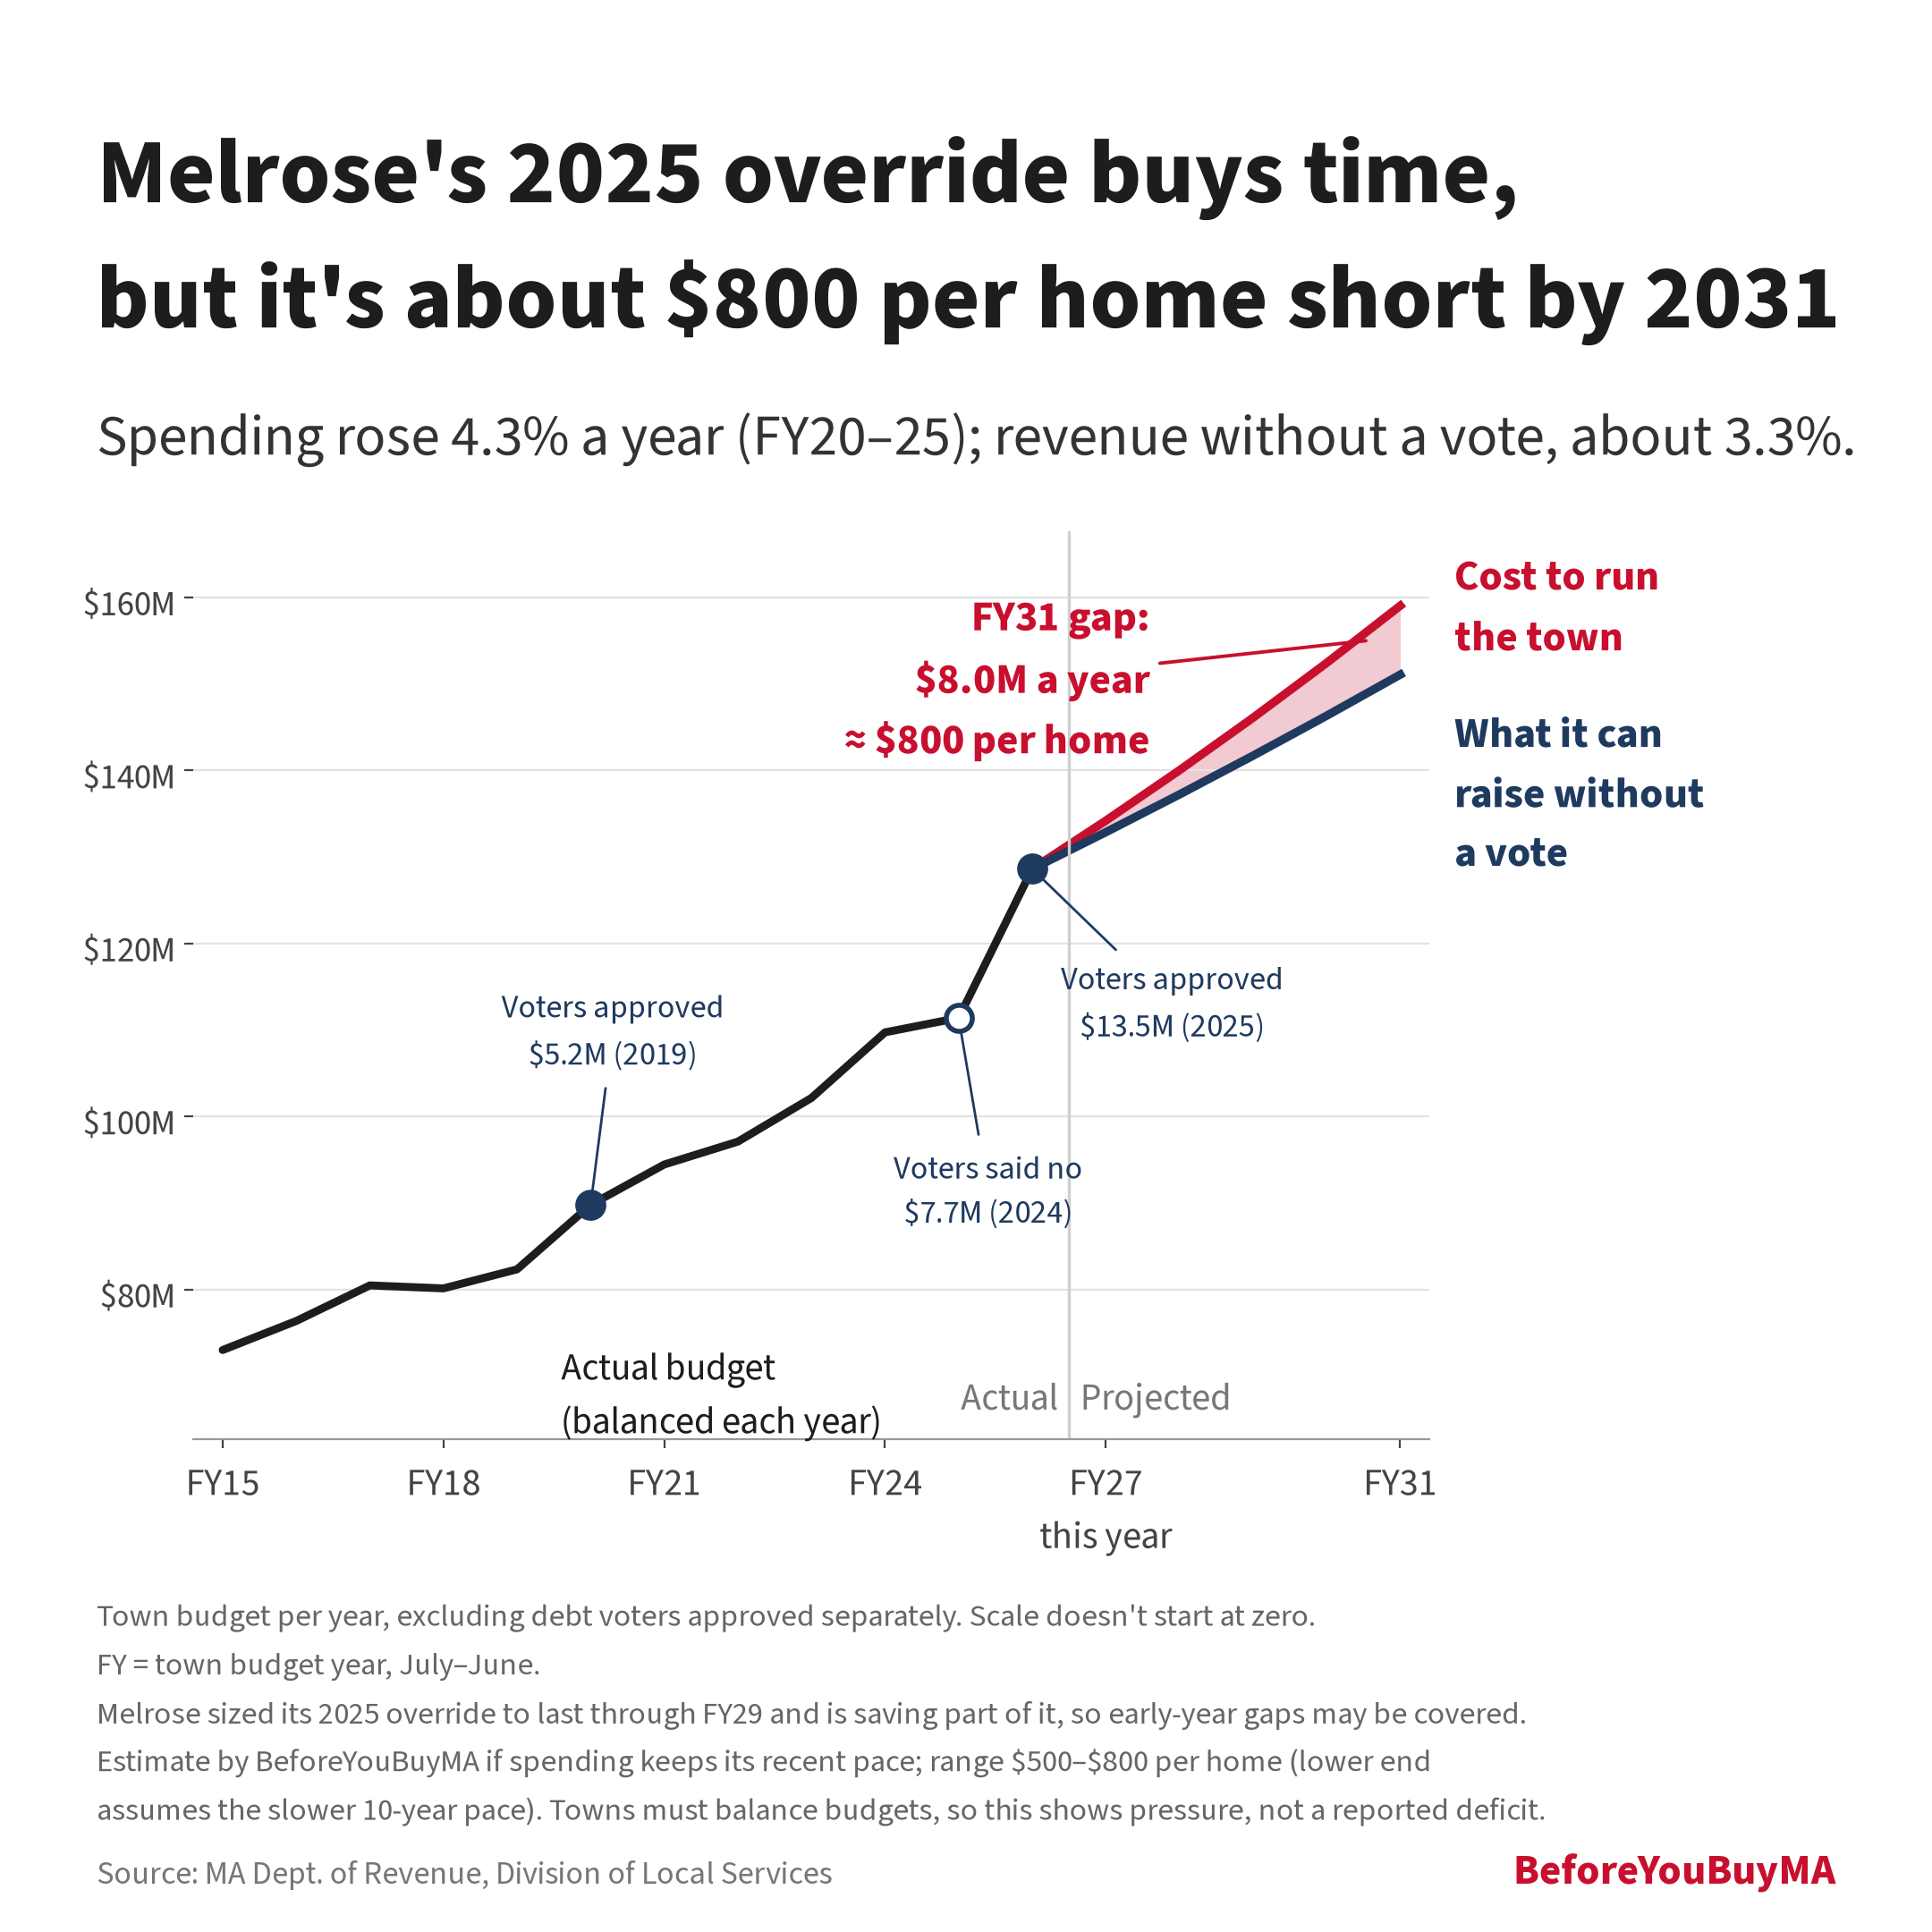
Belmont and Melrose voters have already filled budget gaps with overrides, adding about $2,000 to the average tax bill. In six towns, our estimates show the cost of running the town at its recent pace outgrowing what it can raise without a vote.
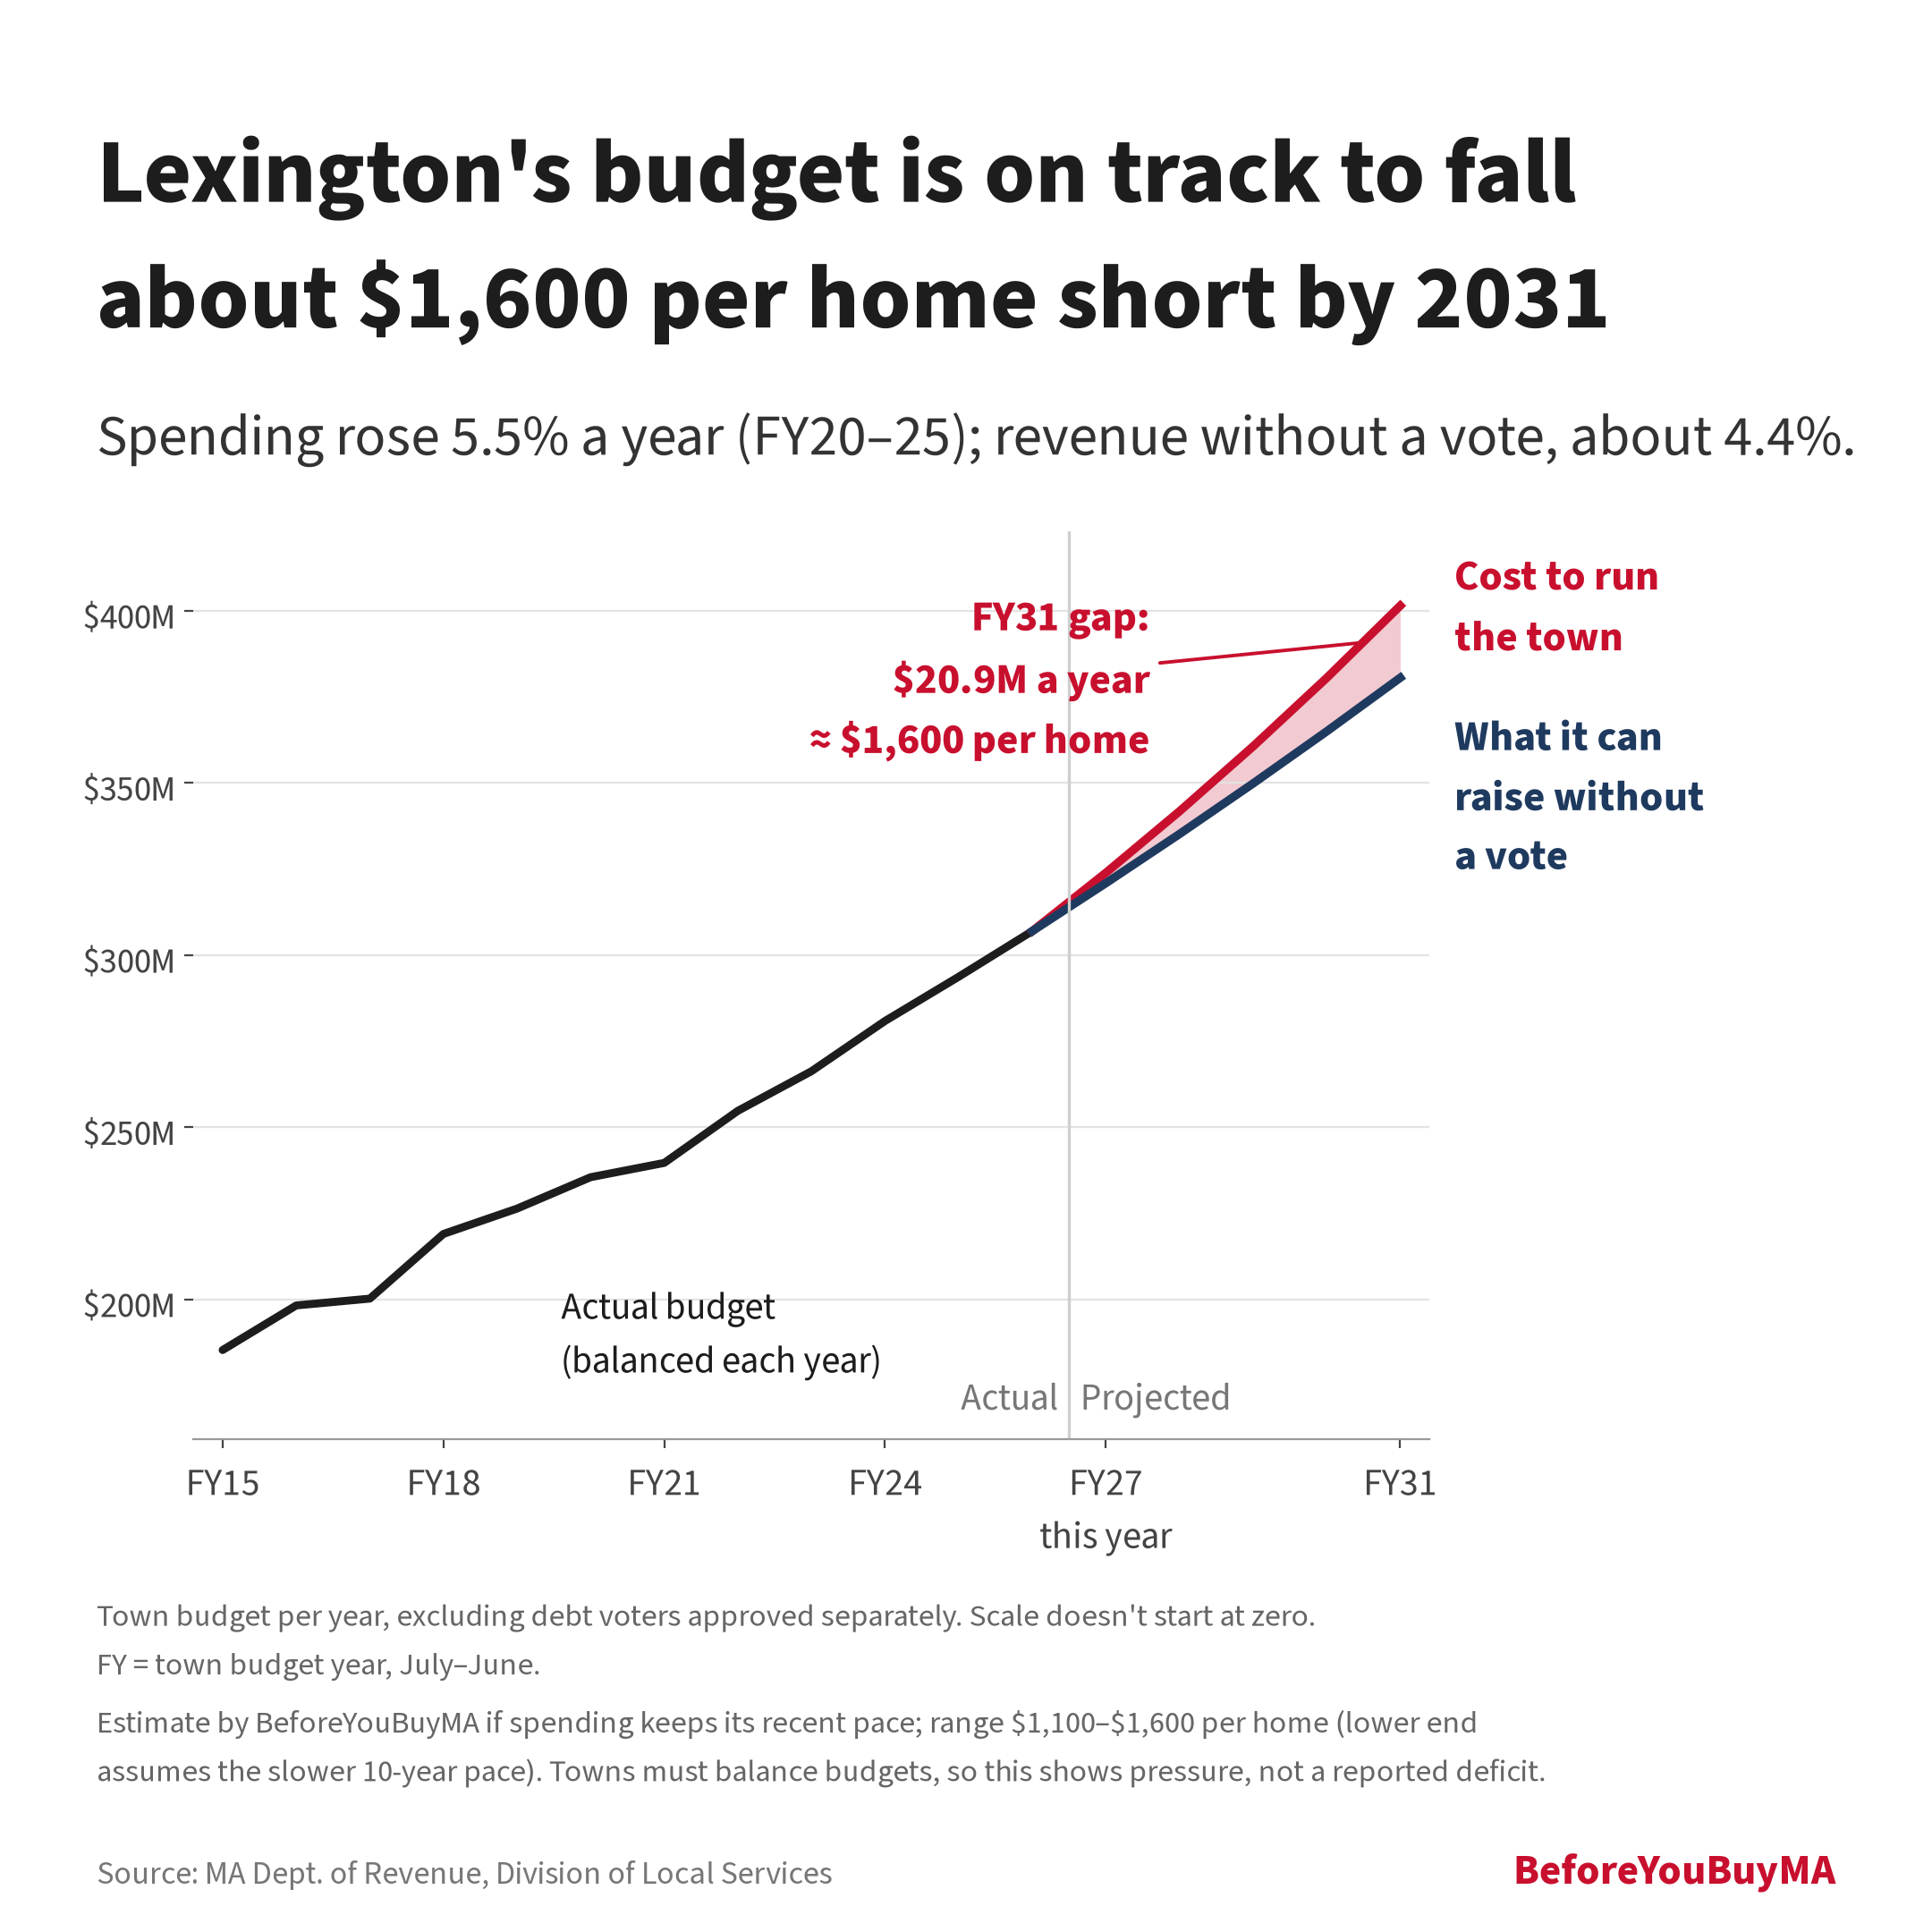
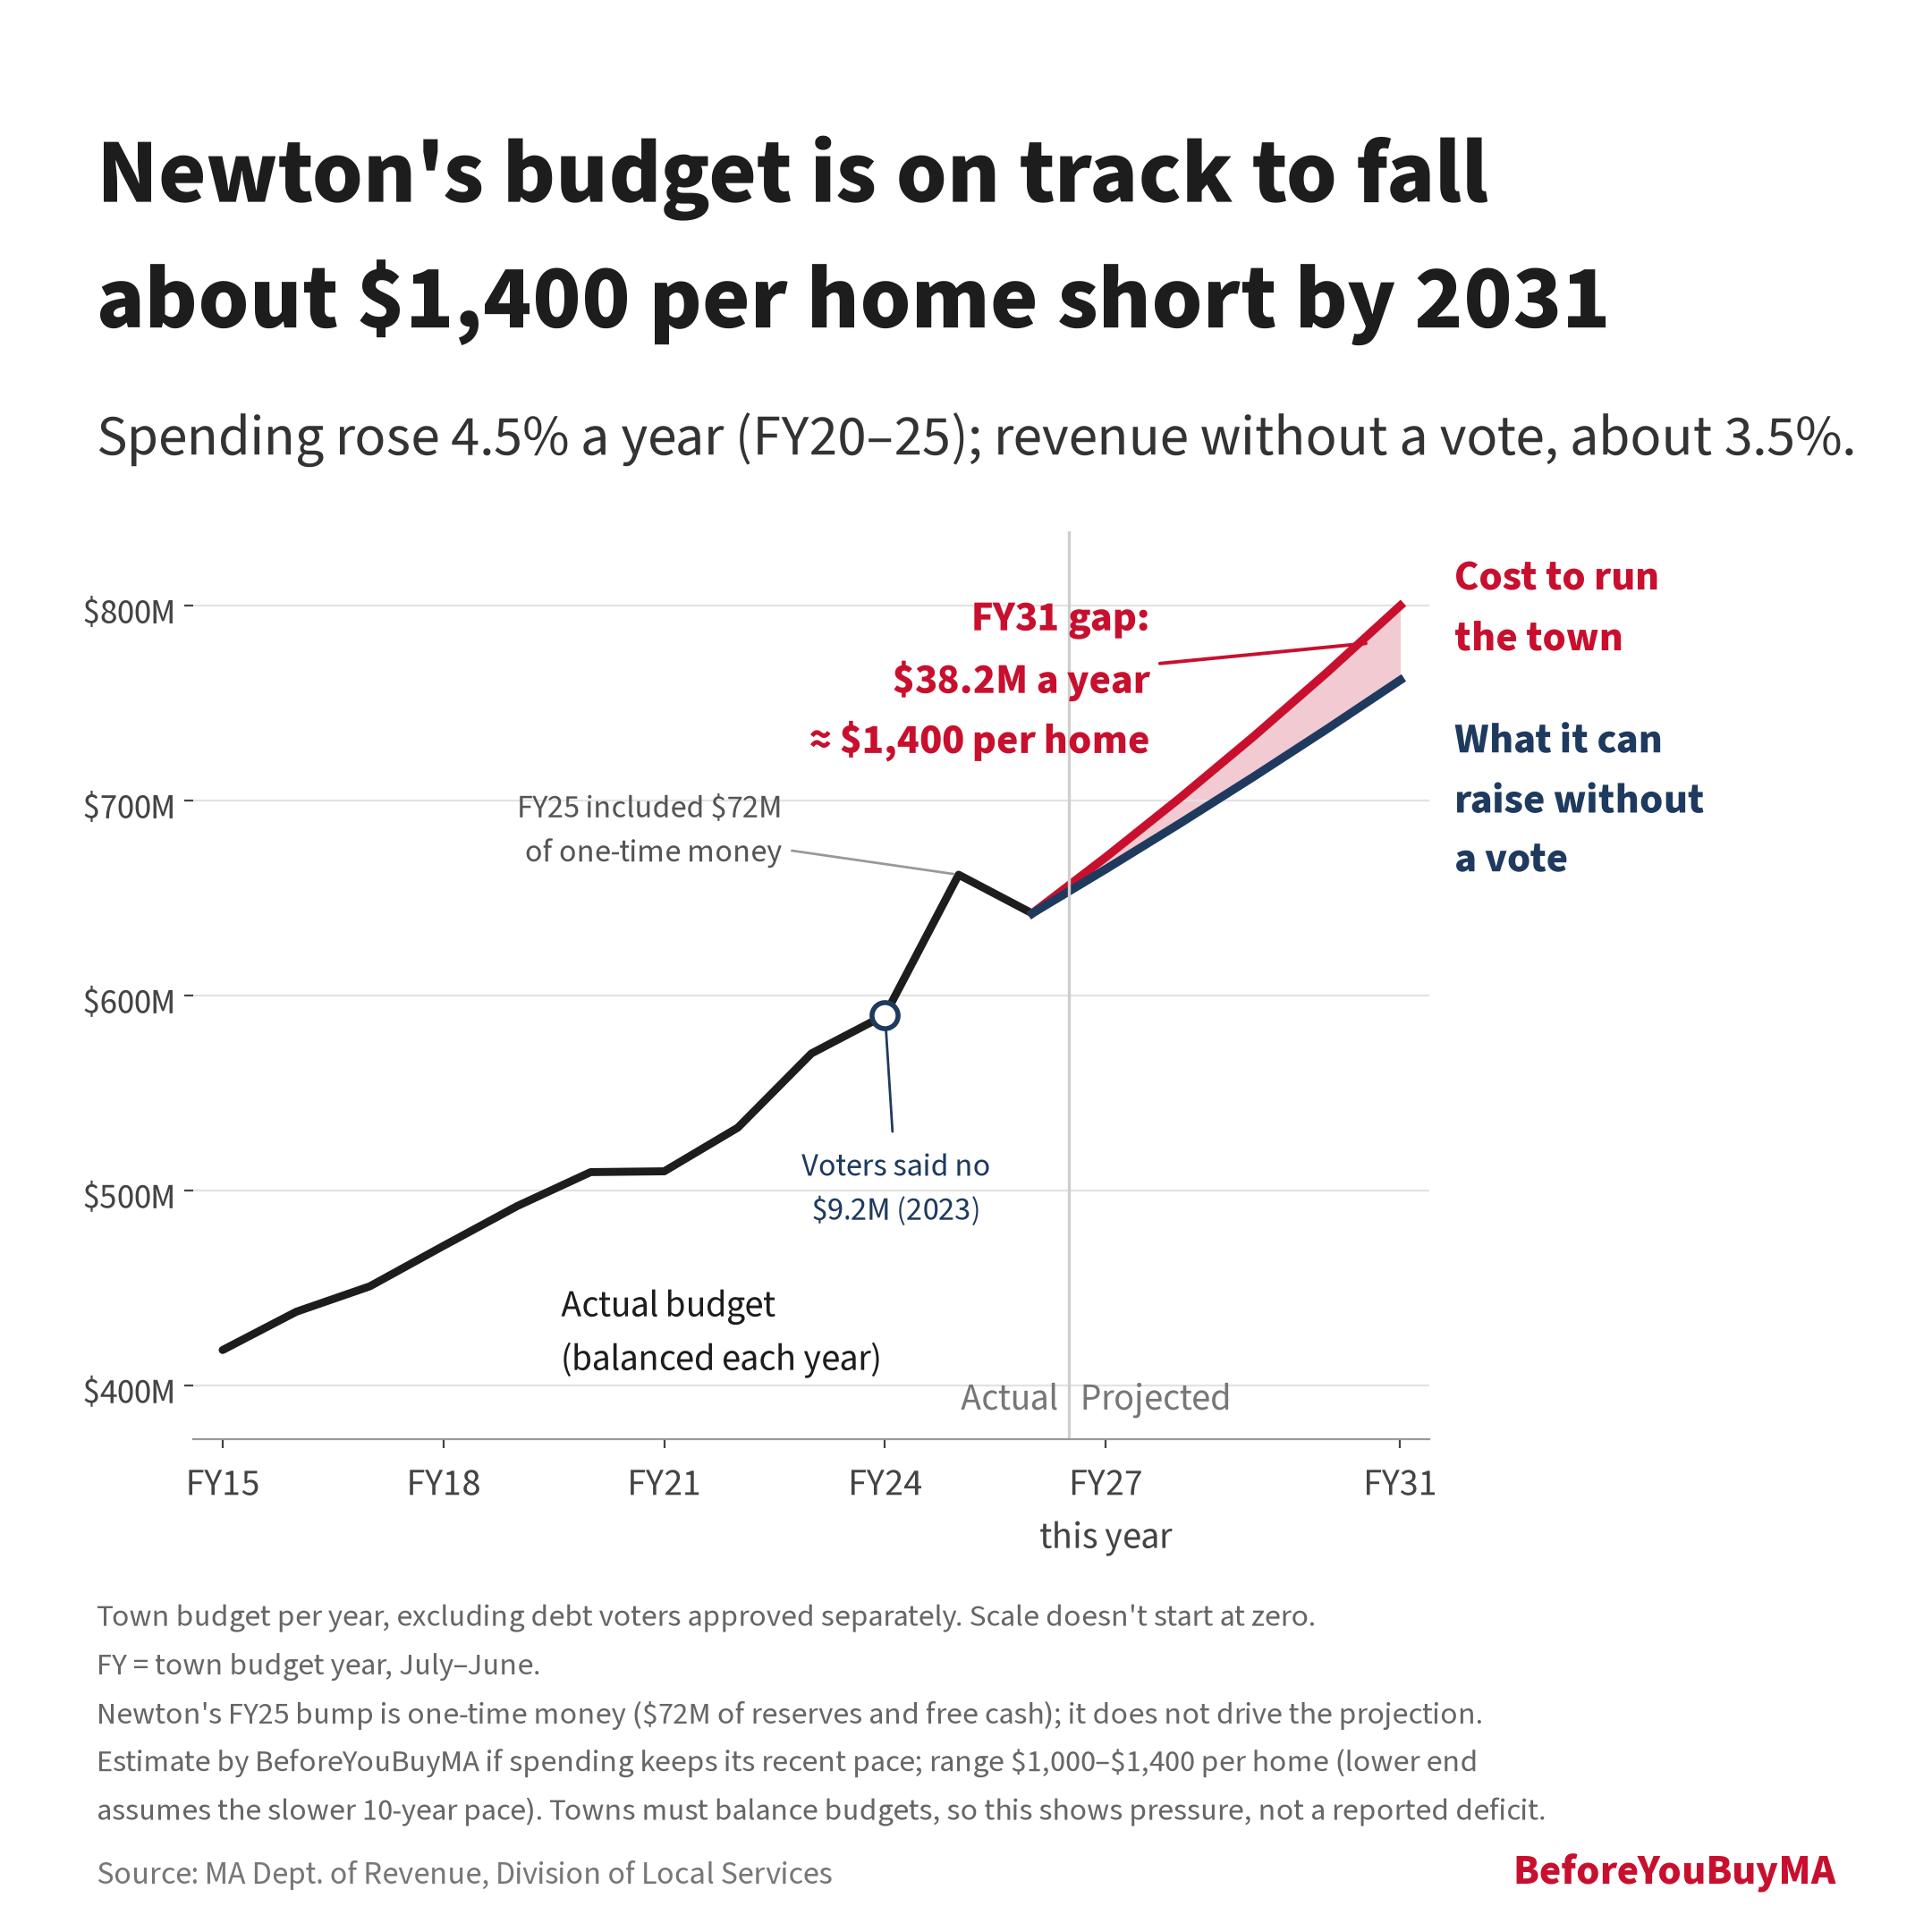
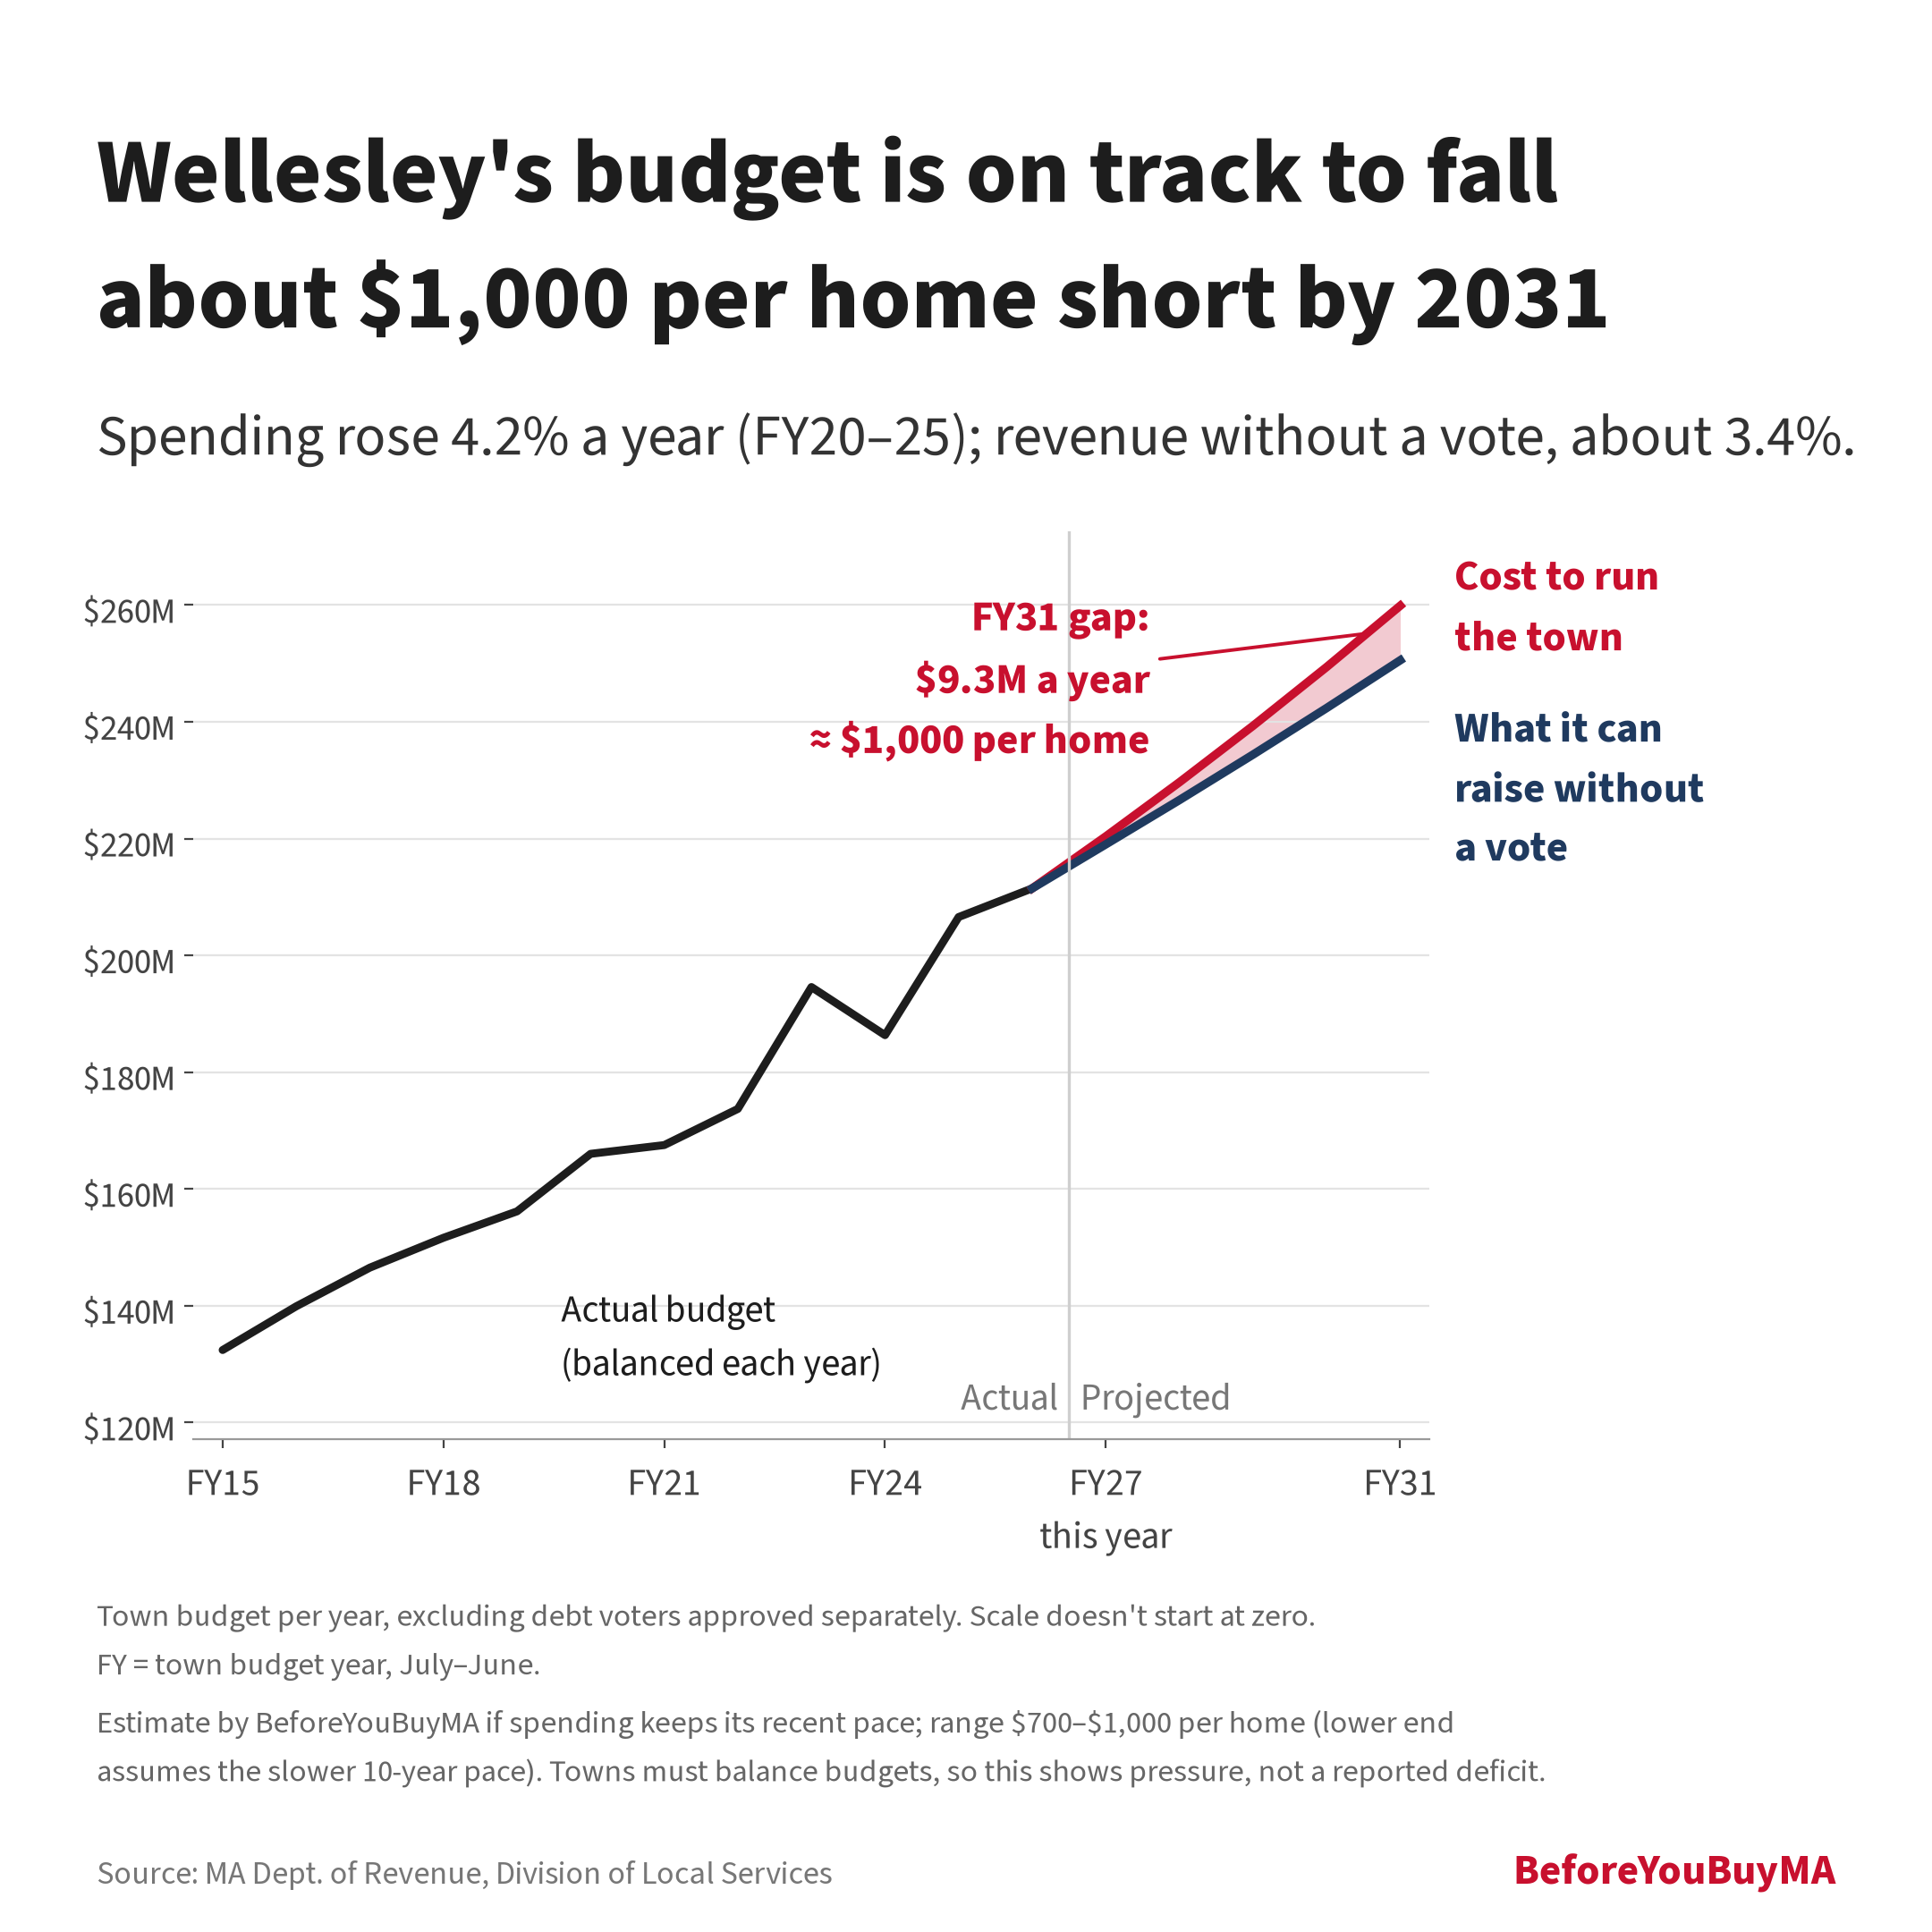
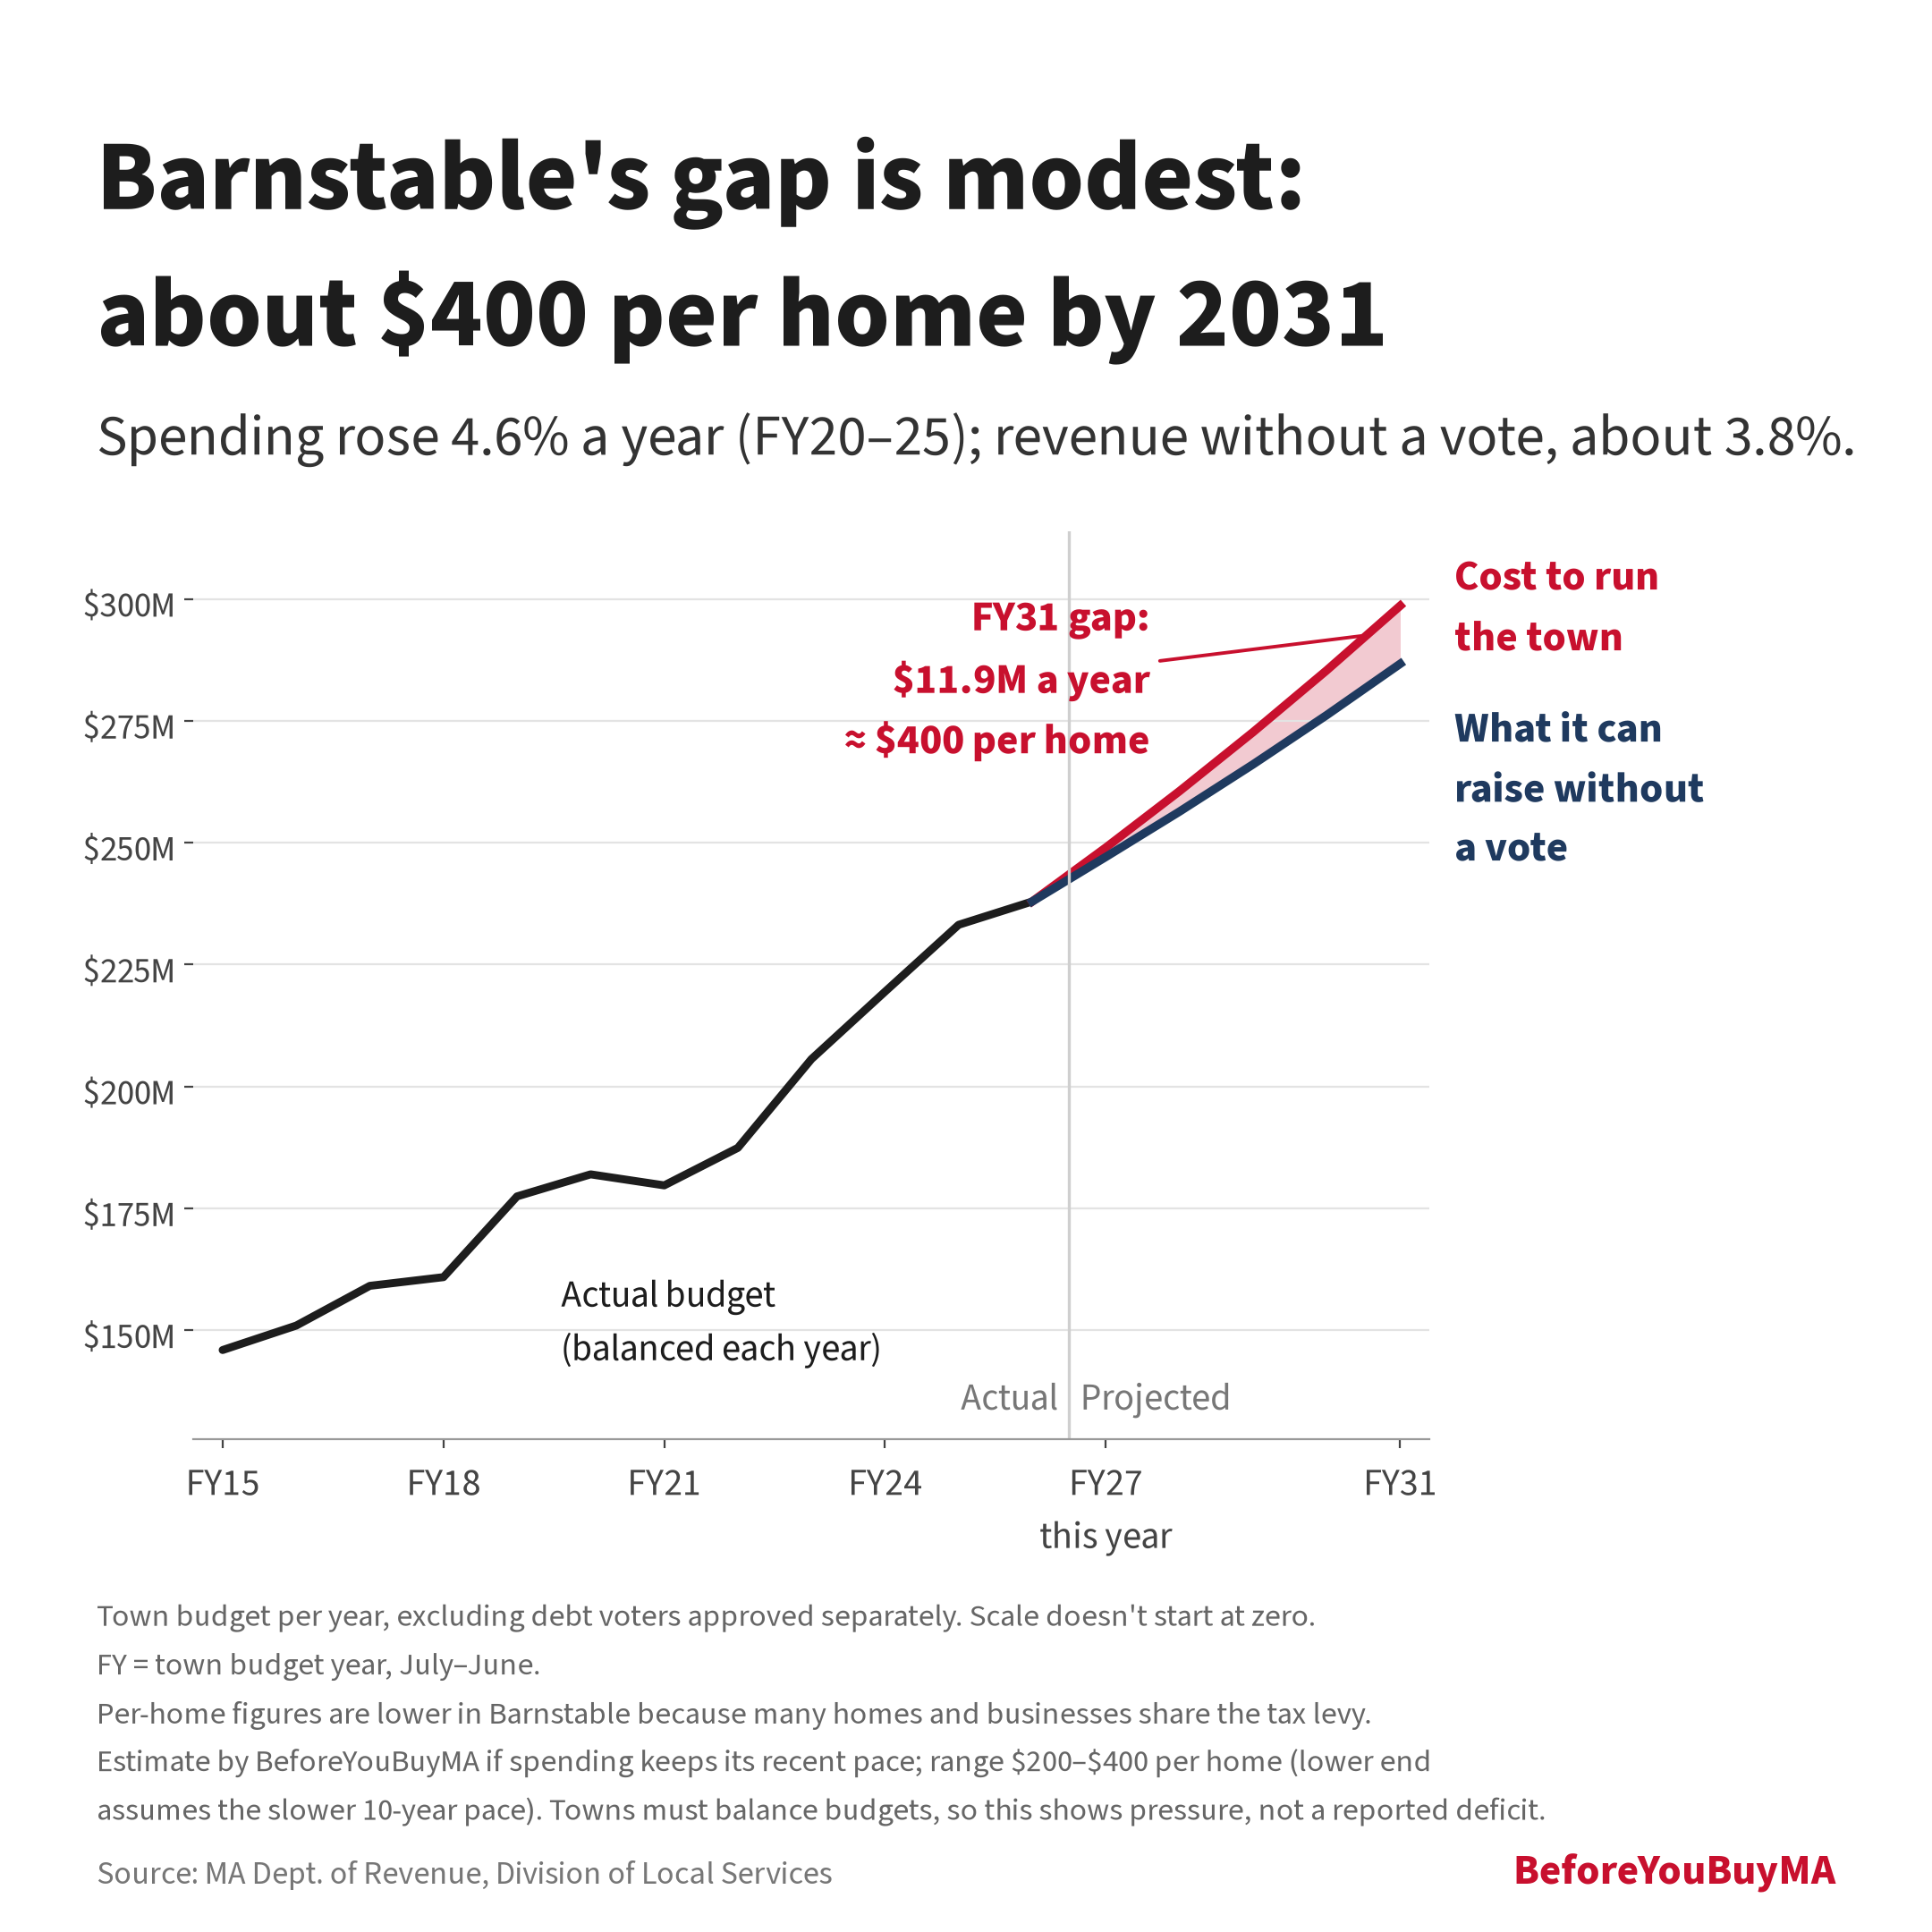
These charts estimate each town's structural gap under Prop 2½: what it costs to keep running the town at its recent pace, against what it can raise without a vote. They are estimates, not reported deficits. Towns must balance their budgets, so a gap gets closed with cuts, reserves, fees or an override vote.
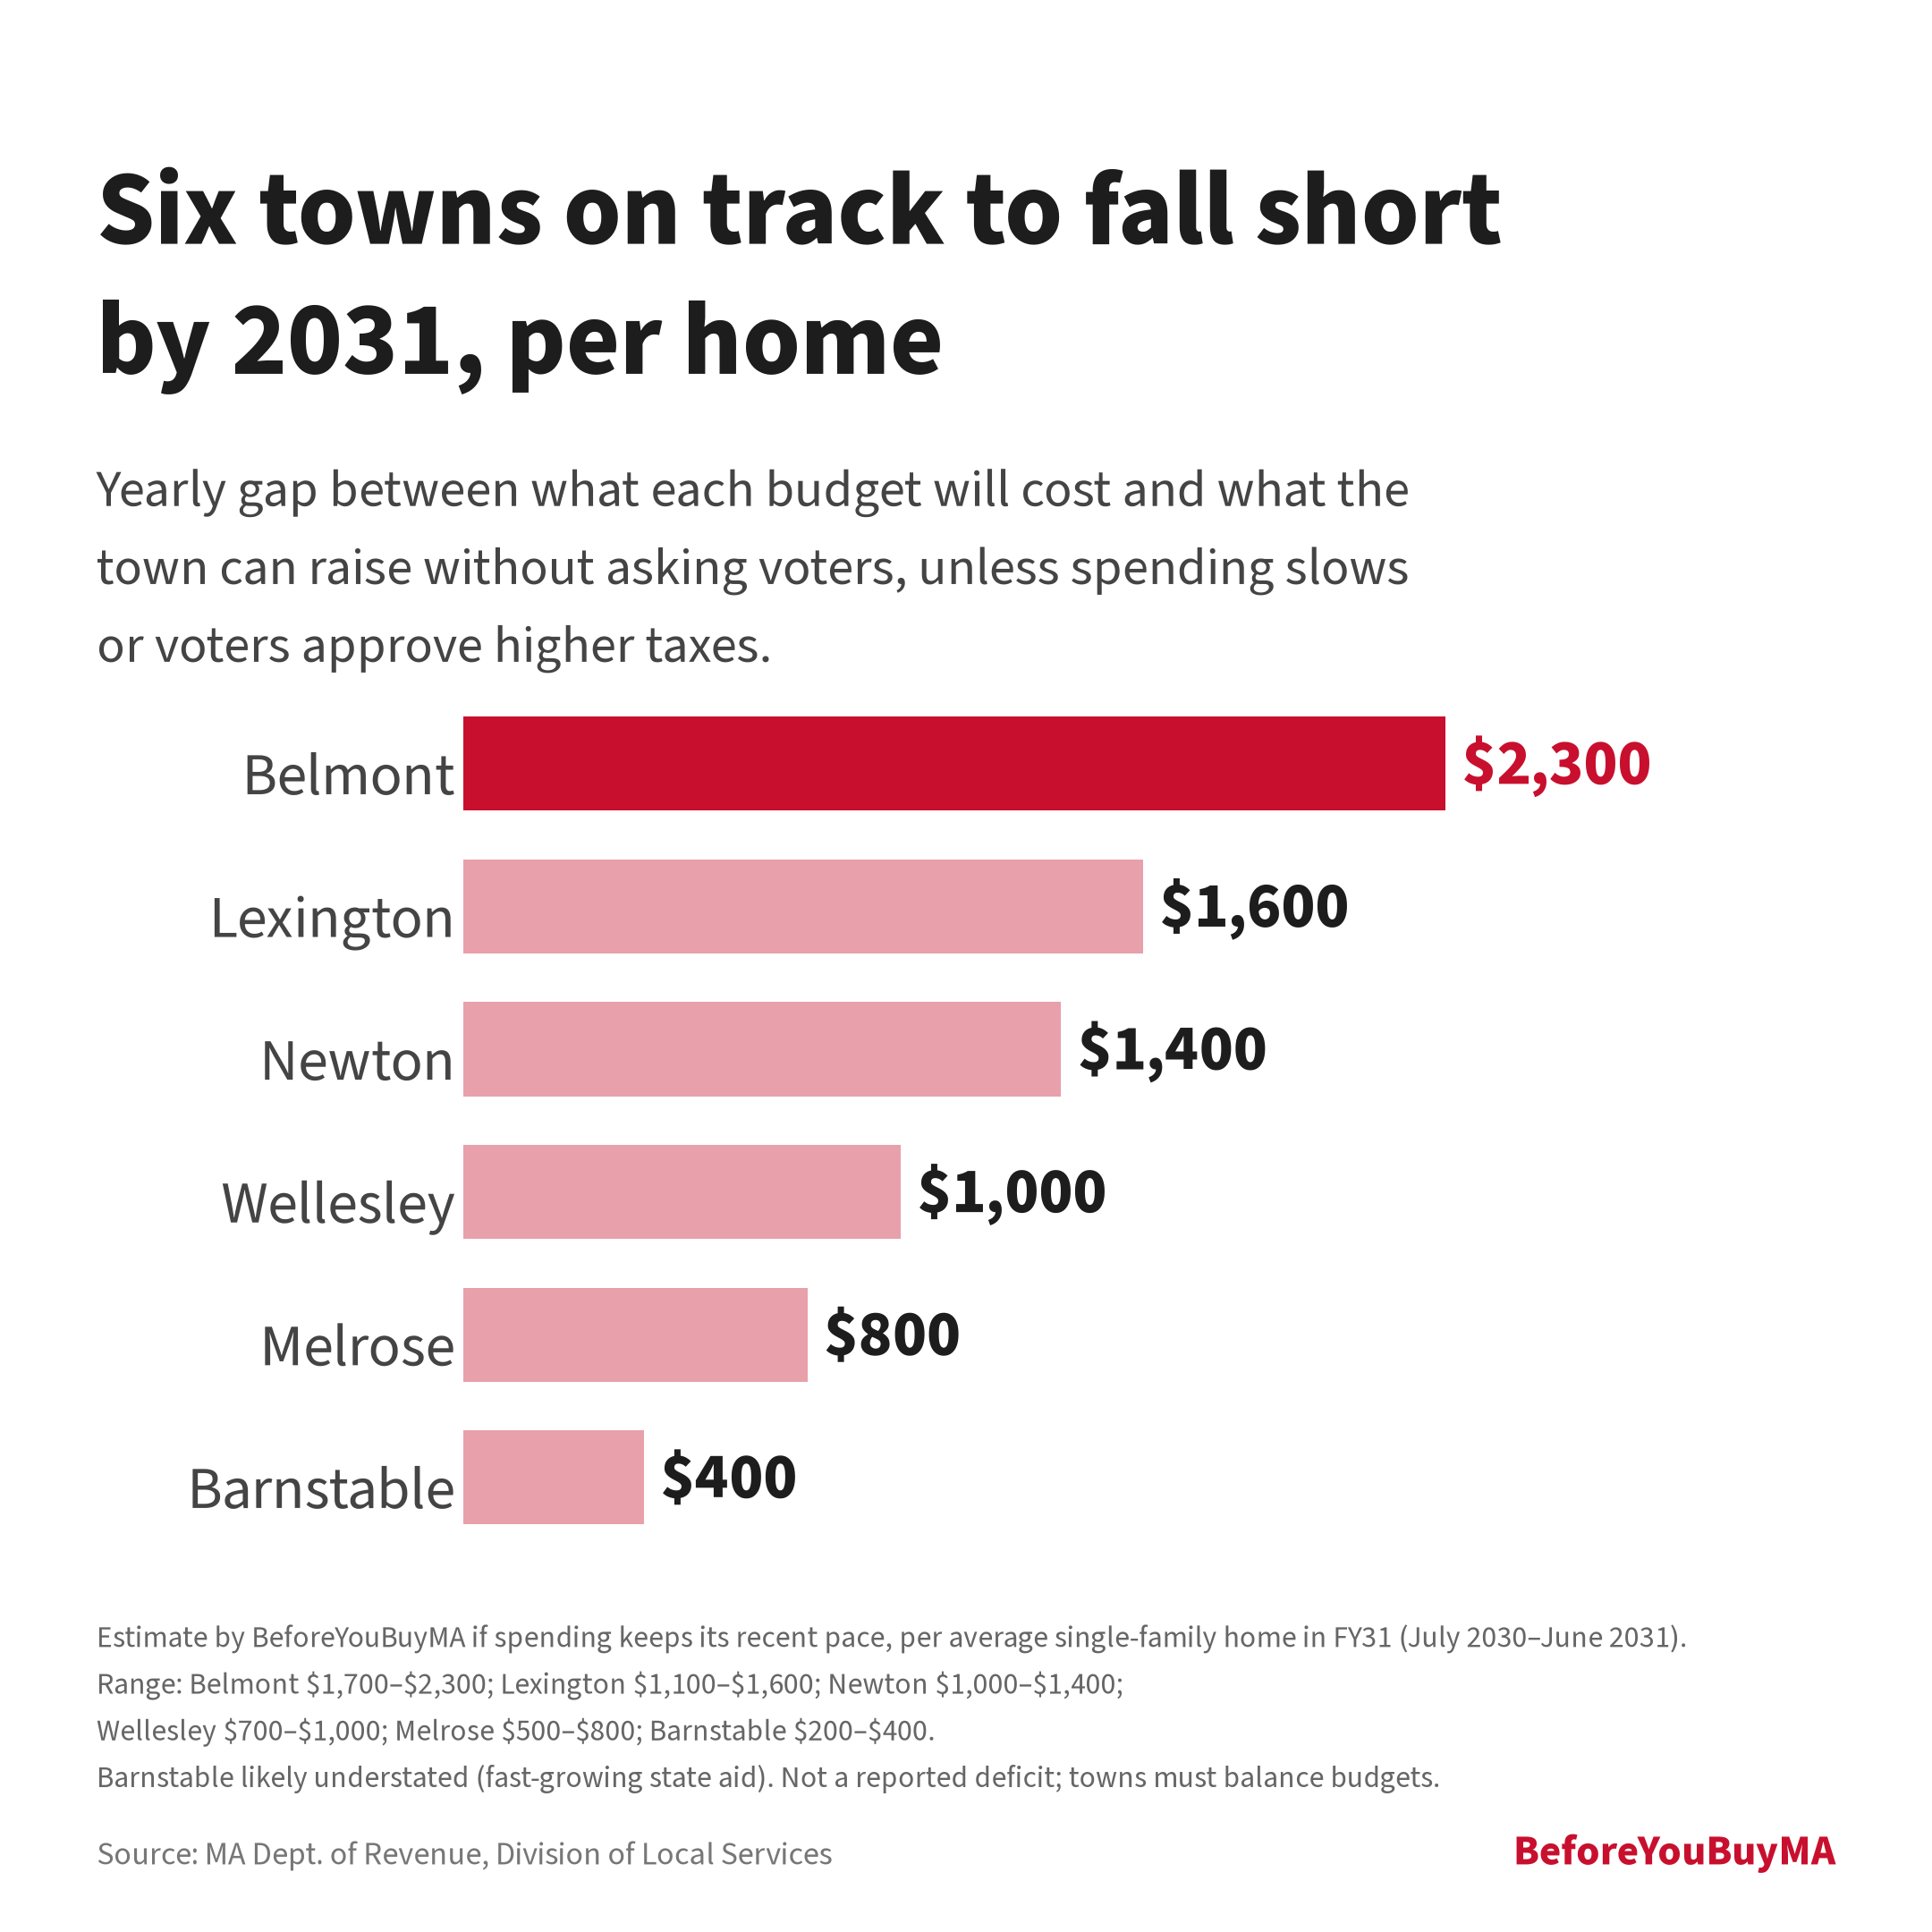
| Town | Gap per home, FY27 (now) | Gap per home, FY31 | FY31 range per home | FY31 gap | % of budget, FY31 | Spending growth, FY20-25 | Revenue growth without a vote |
|---|---|---|---|---|---|---|---|
| Belmont | $390 | $2,300 | $1,700-2,300 | $16.5M | 8.2% | 5.1% | 3.3% |
| Lexington | $230 | $1,600 | $1,100-1,600 | $20.9M | 5.2% | 5.5% | 4.4% |
| Newton | $228 | $1,400 | $1,000-1,400 | $38.2M | 4.8% | 4.5% | 3.5% |
| Melrose | $136 | $800 | $500-800 | $8.0M | 5.0% | 4.3% | 3.3% |
| Wellesley | $151 | $1,000 | $700-1,000 | $9.3M | 3.6% | 4.2% | 3.5% |
| Barnstable | $69 | $400 | $200-400 | $11.9M | 4.0% | 4.7% | 3.8% |
What voters filled: Belmont and Melrose
Budget gap by town
Towns with full chart stories
- Belmont
- Melrose
- Wellesley
- Lexington
- Newton
- Needham
- Concord
- Hingham
- Winchester
- Westwood
- Sudbury
- Marblehead
- Barnstable
Method and caveats
- Cost: the FY26 budget (treated as balanced) grown at the town's FY20-25 general-fund spending growth, excluding debt service. The lower end of each range uses the slower FY15-25 pace.
- What a town can raise without a vote: levy limit plus 2.5% a year, average FY22-26 new growth, and state aid and local receipts at their FY16-26 trend. No new overrides.
- Per home: gap × FY26 average single-family tax bill ÷ total tax levy. Debt voters approved separately is left out on both sides.
- Tax-bill charts: each approved override grows 2.5% a year, as the tax limit does, and is removed from the levy; the average bill shrinks by the same share. Belmont: $19,579 actual vs about $17,535 without; Melrose: $9,787 vs about $7,792 (FY26).
- Data lag: spending data runs through FY25 and levy and revenue through FY26, so FY27 onward is projected.
- Melrose sized its November 2025 override ($13.5M) to last through FY29 and is saving part of it, so its early-year gaps may be covered by those savings.
- Newton: FY25 revenue included $72.25M of one-time money (DLS 'All Other', usually $27-32M), mainly FY24 mid-year appropriations of $49.0M from free cash and overlay surplus (including $22M into a school stabilization fund) plus $22.9M of FY25 transfers and fund balance. It sits in revenue, not in the spending that sets cost growth (FY25 spending rose 4.7%). Dropping FY25 from the growth rate gives $1,356 per home in FY31 instead of $1,415, so the estimate stays at about $1,400.
- Revenue by Source (FY25 'All Other' by town) (MA DLS Databank)
- Newton FY2026 Comptroller's Budget Analysis (FY24 and FY25 supplemental appropriations) (newtonma.gov)
- Newton FY2025 Comptroller's Budget Analysis (newtonma.gov)
- DLS Municipal Databank (mass.gov)