Melrose, MA: town finances
Fair finances; below-typical savings (5% of budget vs 7.3% typical); 3 override votes since 2016; another override vote likely.
Budget grade
Better than 26% of MA towns · score 71 of 100
Ability to pay
Above the state median for income and property value
Shown separately; not part of the budget grade. Income per resident $67,861 (Census ACS 2020-24); property value (EQV) per resident $277,522 (DLS 2024).
Chance of an override vote
7 points on our 0-8 scale: Low 0-2, Medium 3-4, High 5+. It ranks towns; it is not a percentage.
The story in charts
Melrose: a failed override, then a record one, and teacher cuts anyway
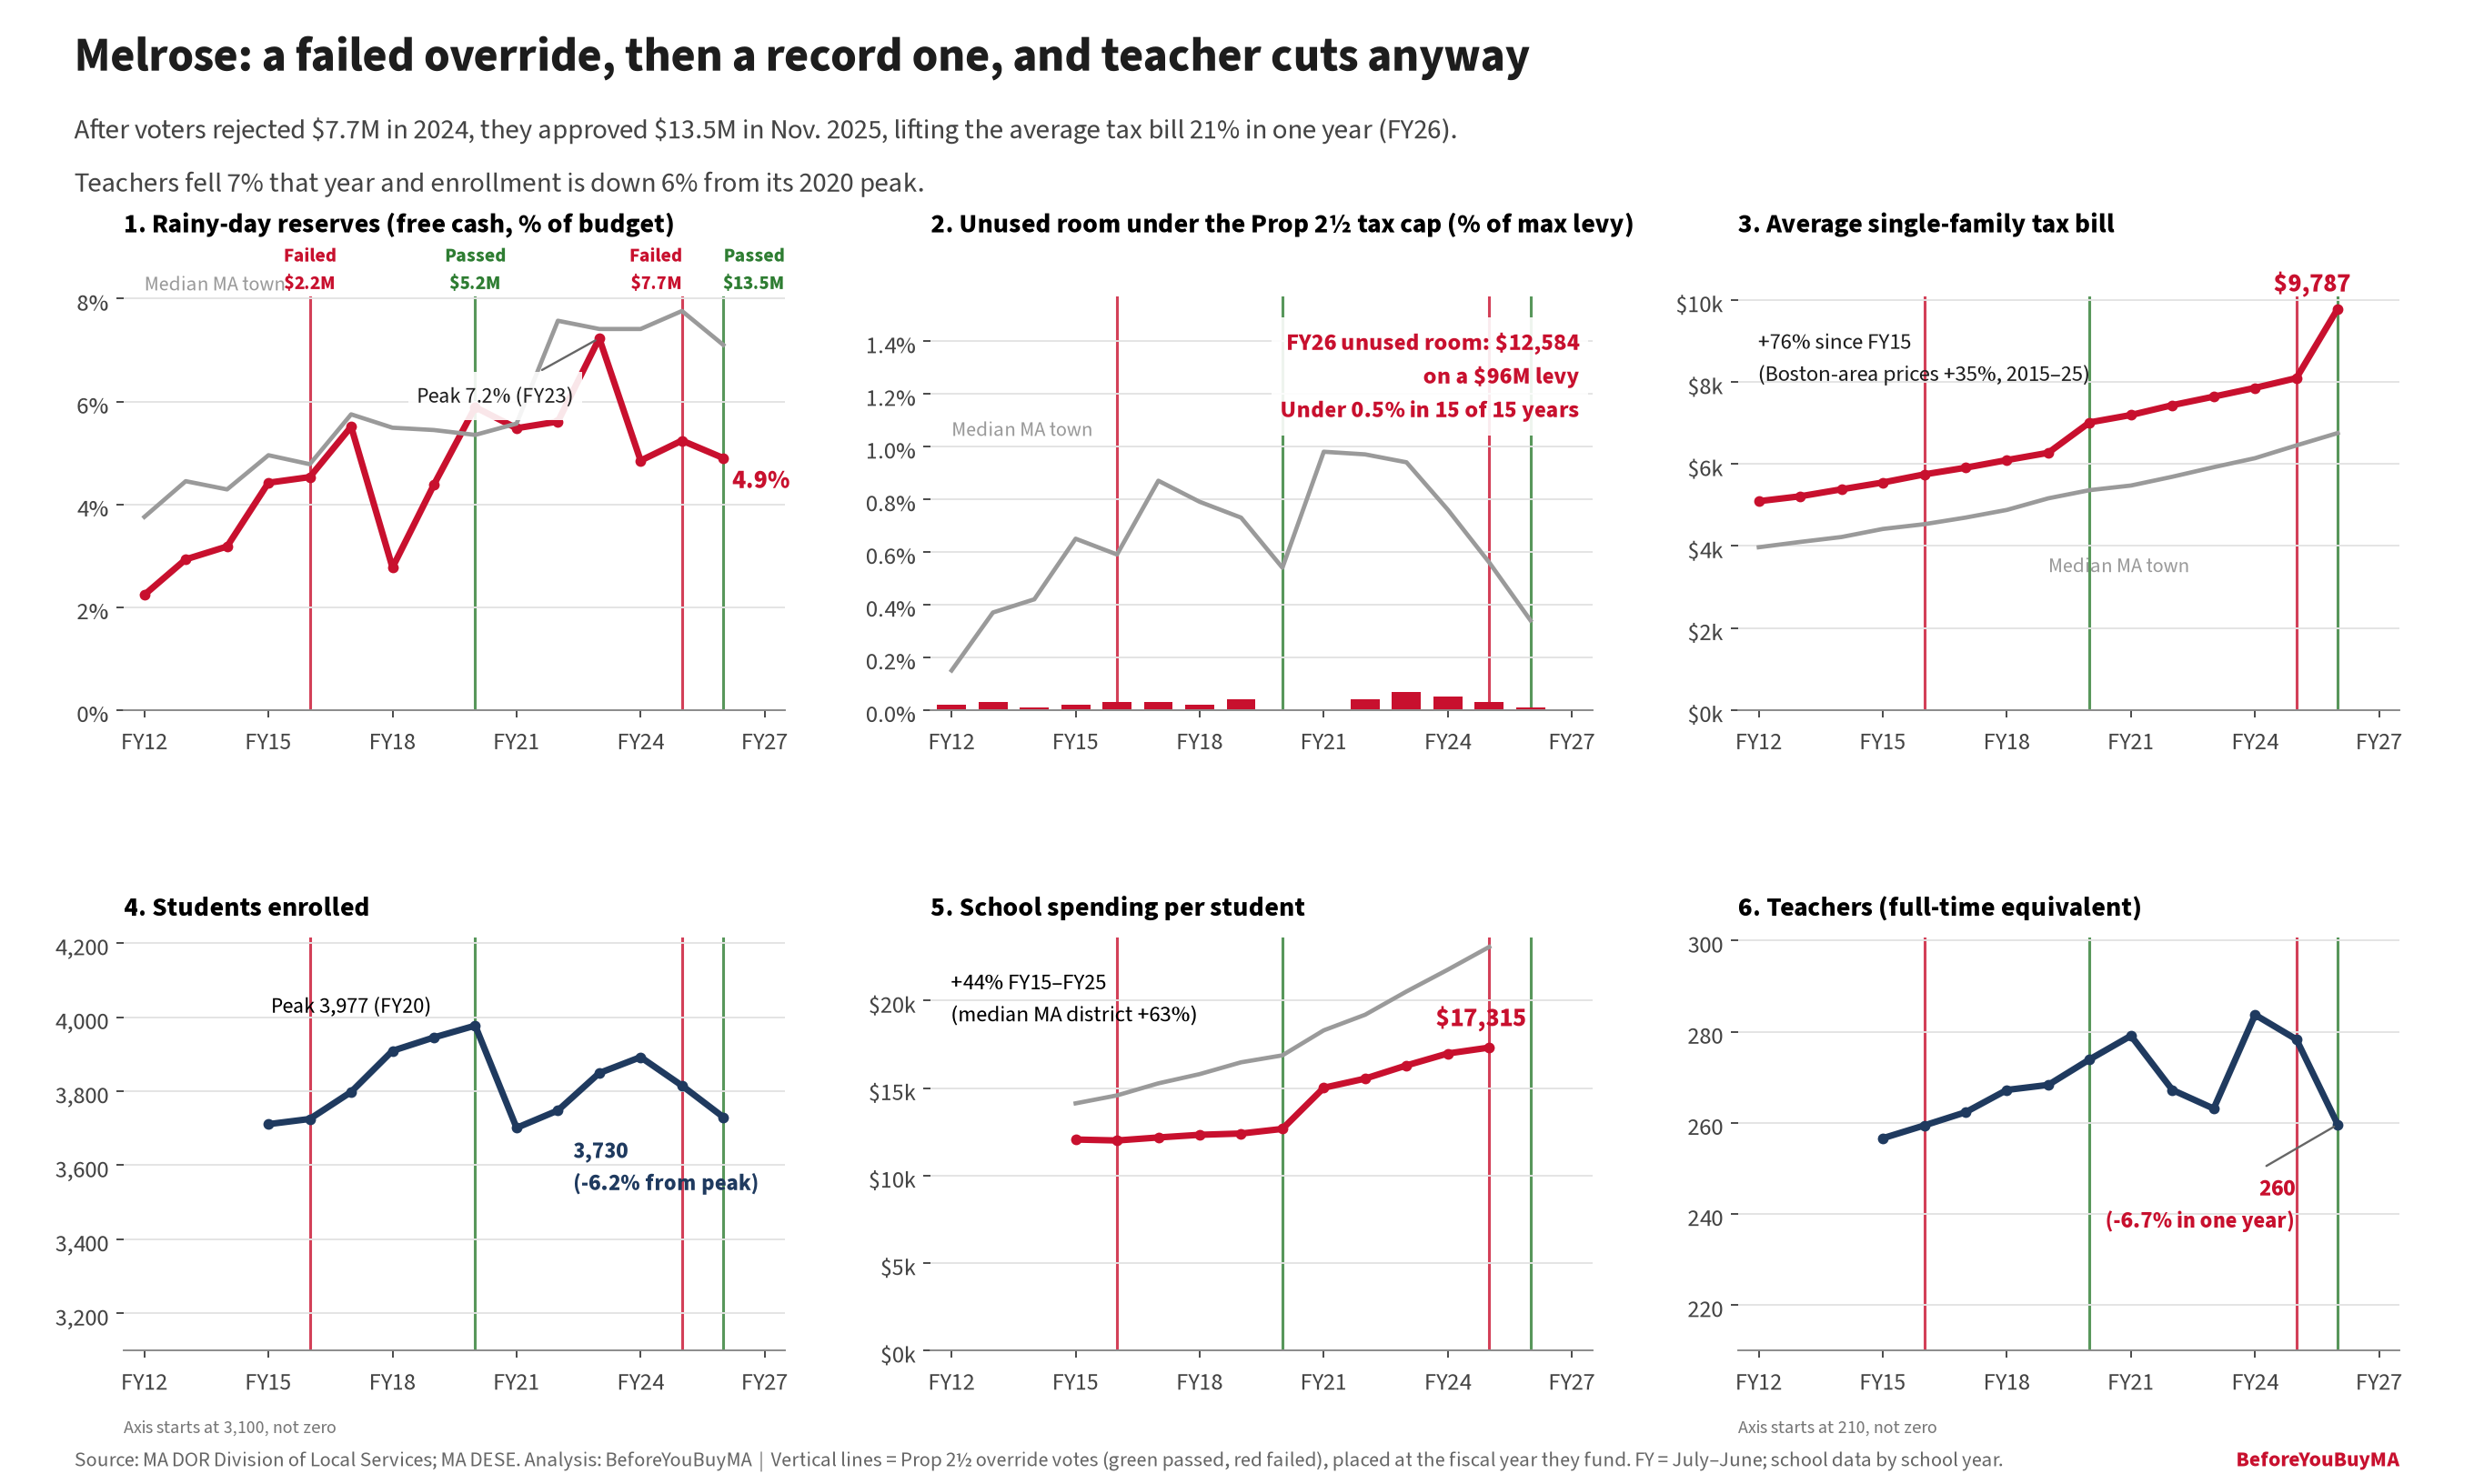
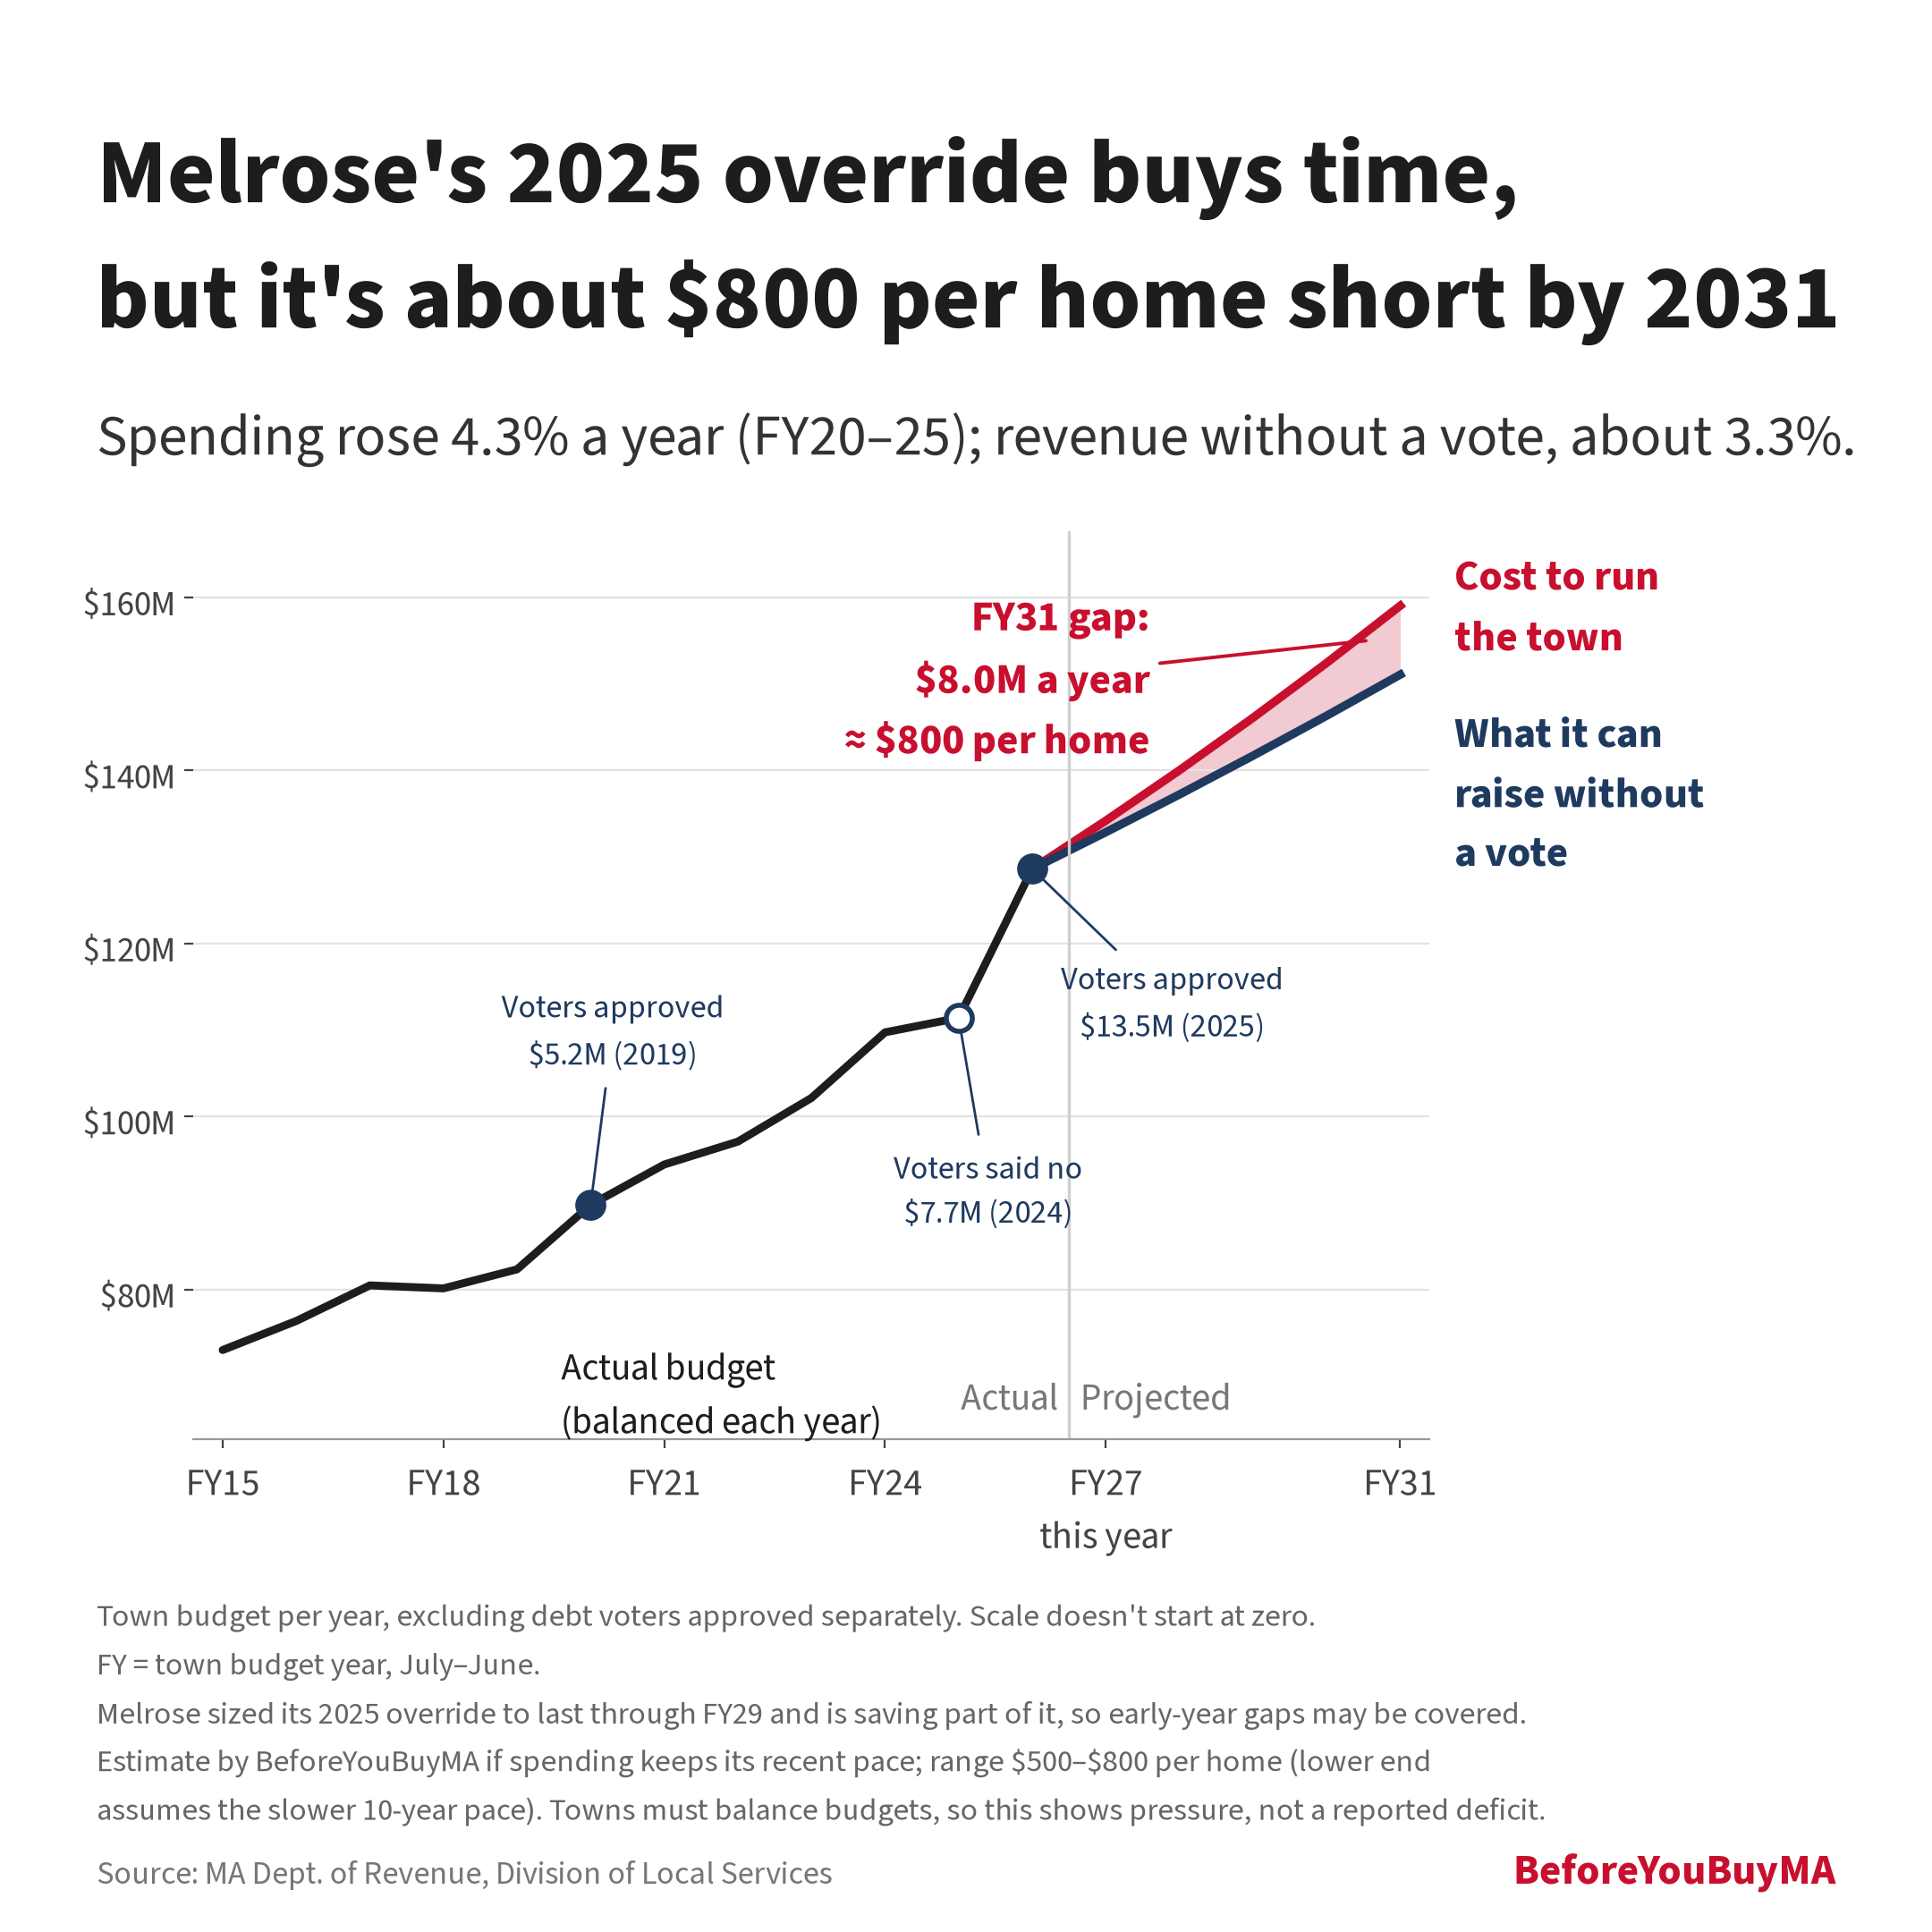
The next charts estimate Melrose's structural gap under Prop 2½: what it costs to keep running the town at its recent pace, against what it can raise without a vote. They are estimates, not reported deficits. Towns must balance their budgets, so a gap gets closed with cuts, reserves, fees or an override vote. Method and other towns
Melrose's 2025 override buys time, but it's about $800 per home short by 2031
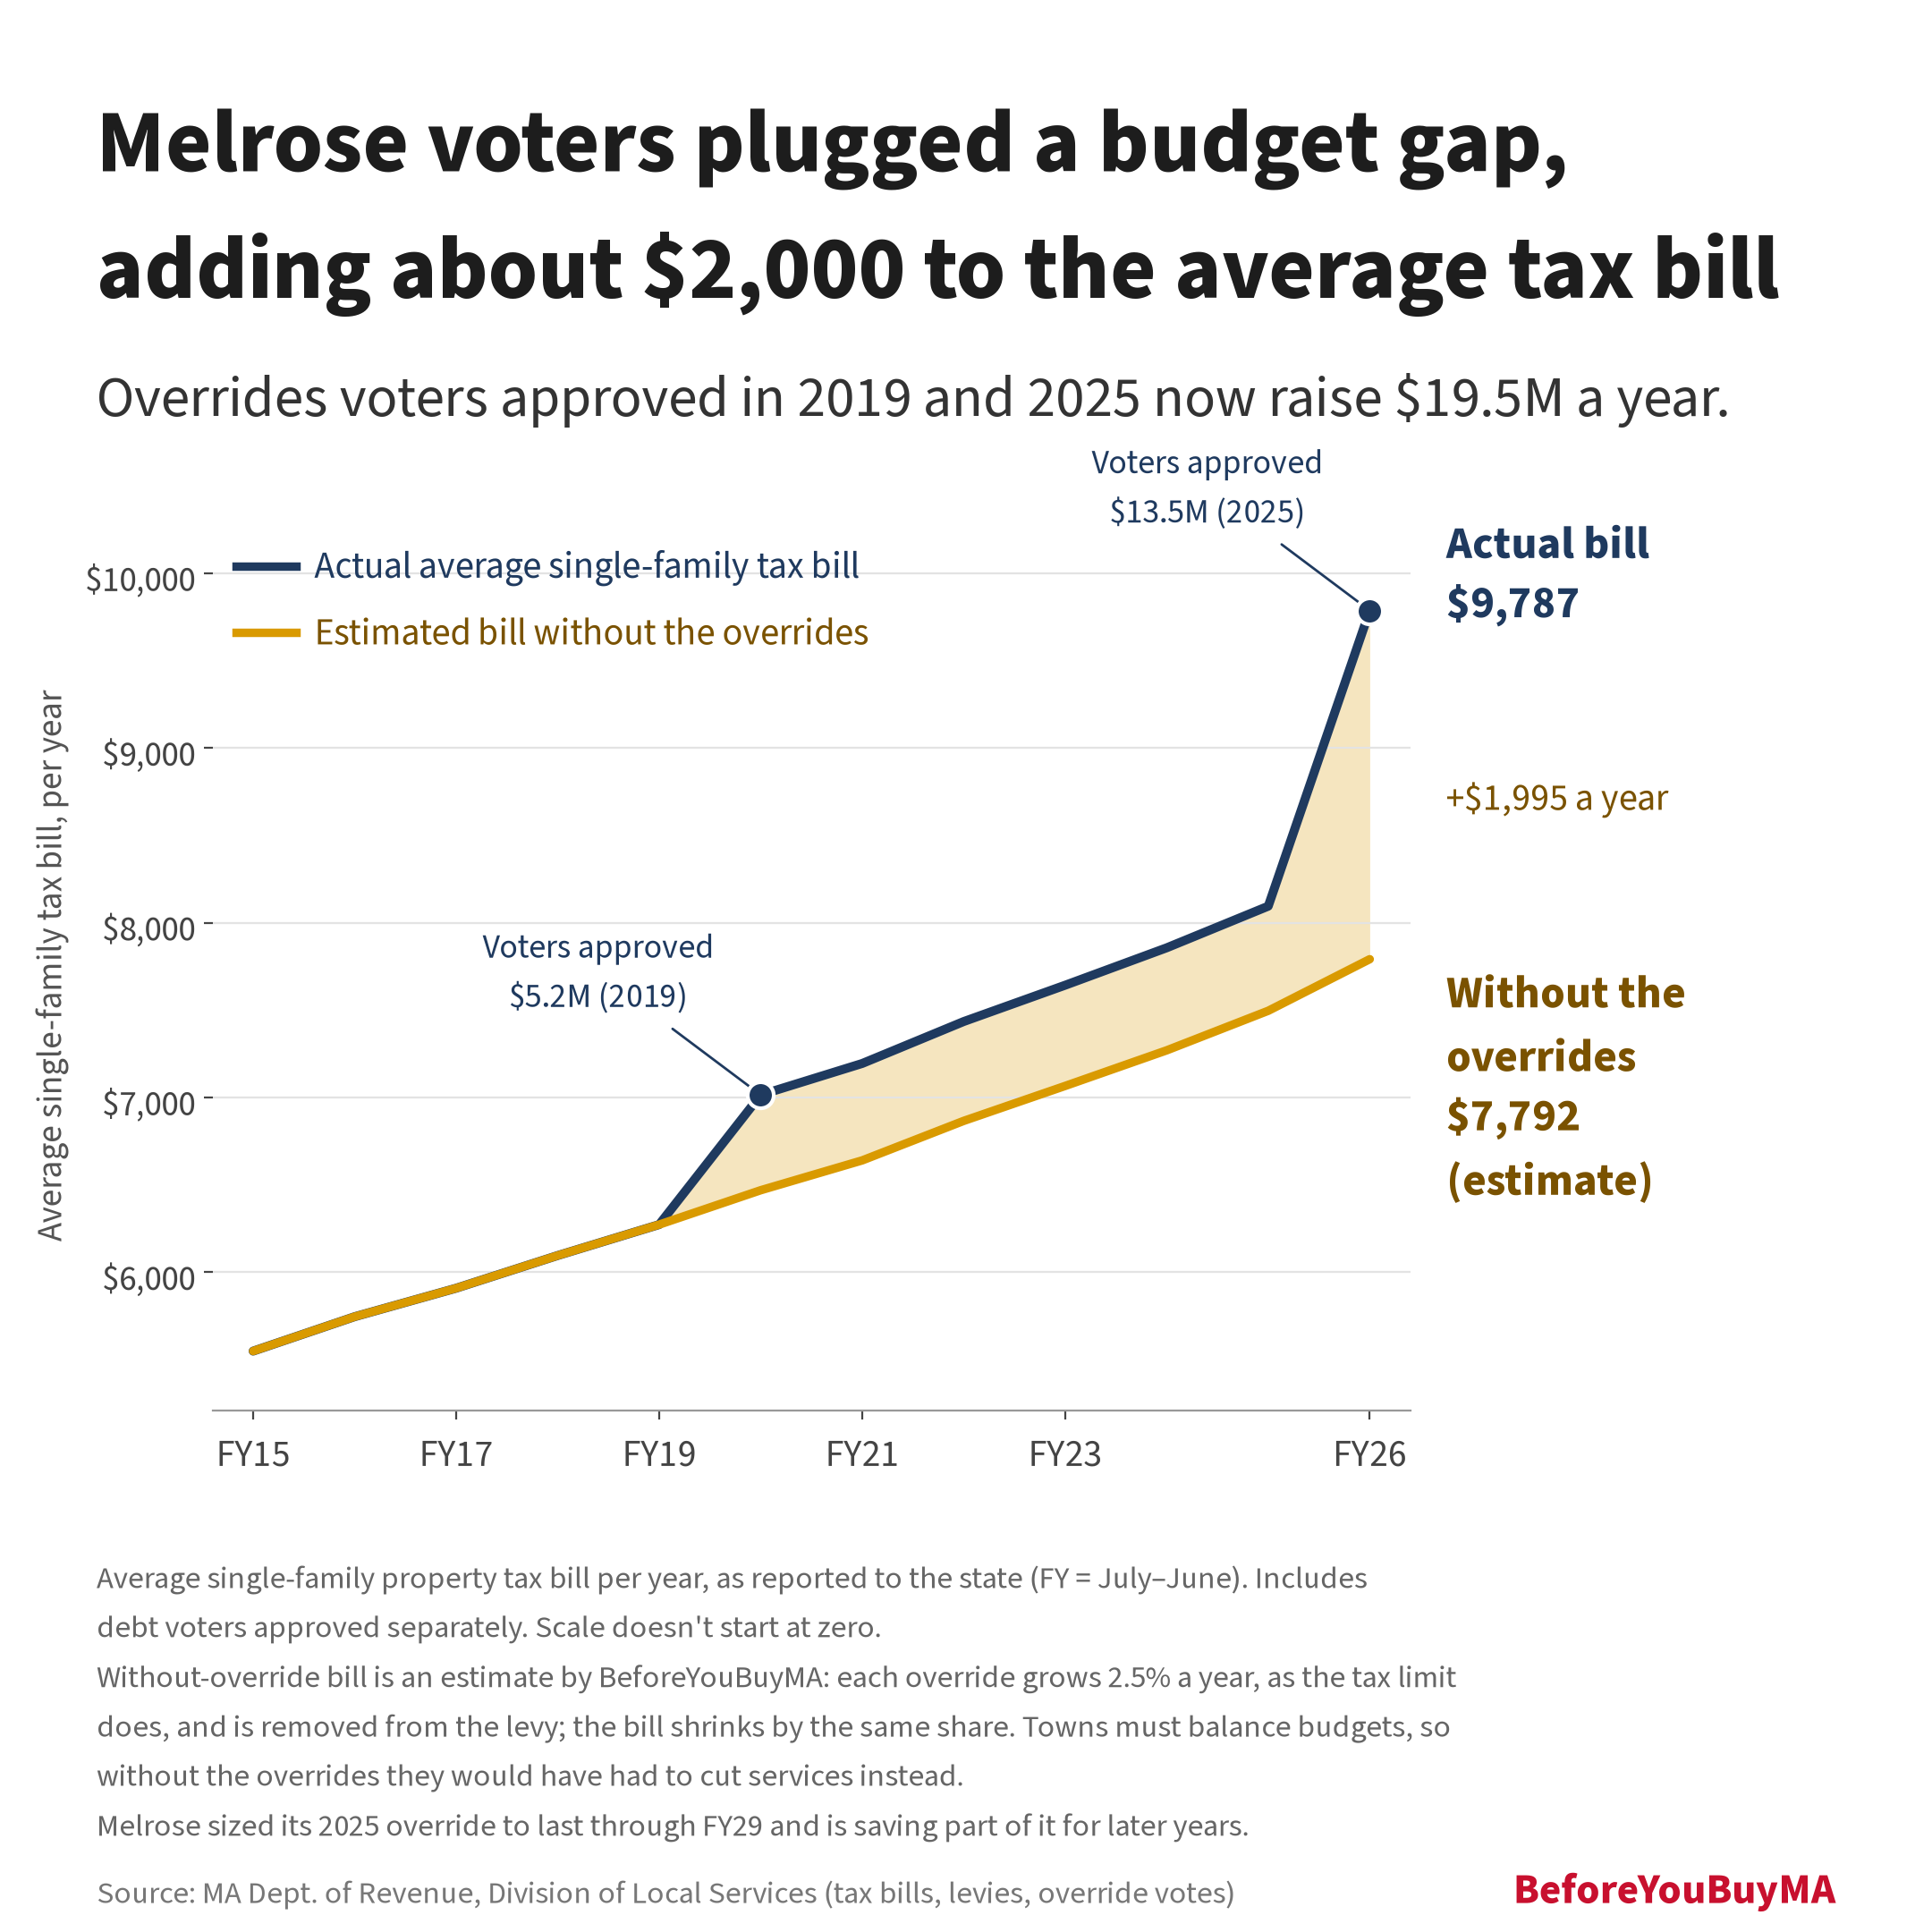
Melrose voters plugged a budget gap, adding about $2,000 to the average tax bill
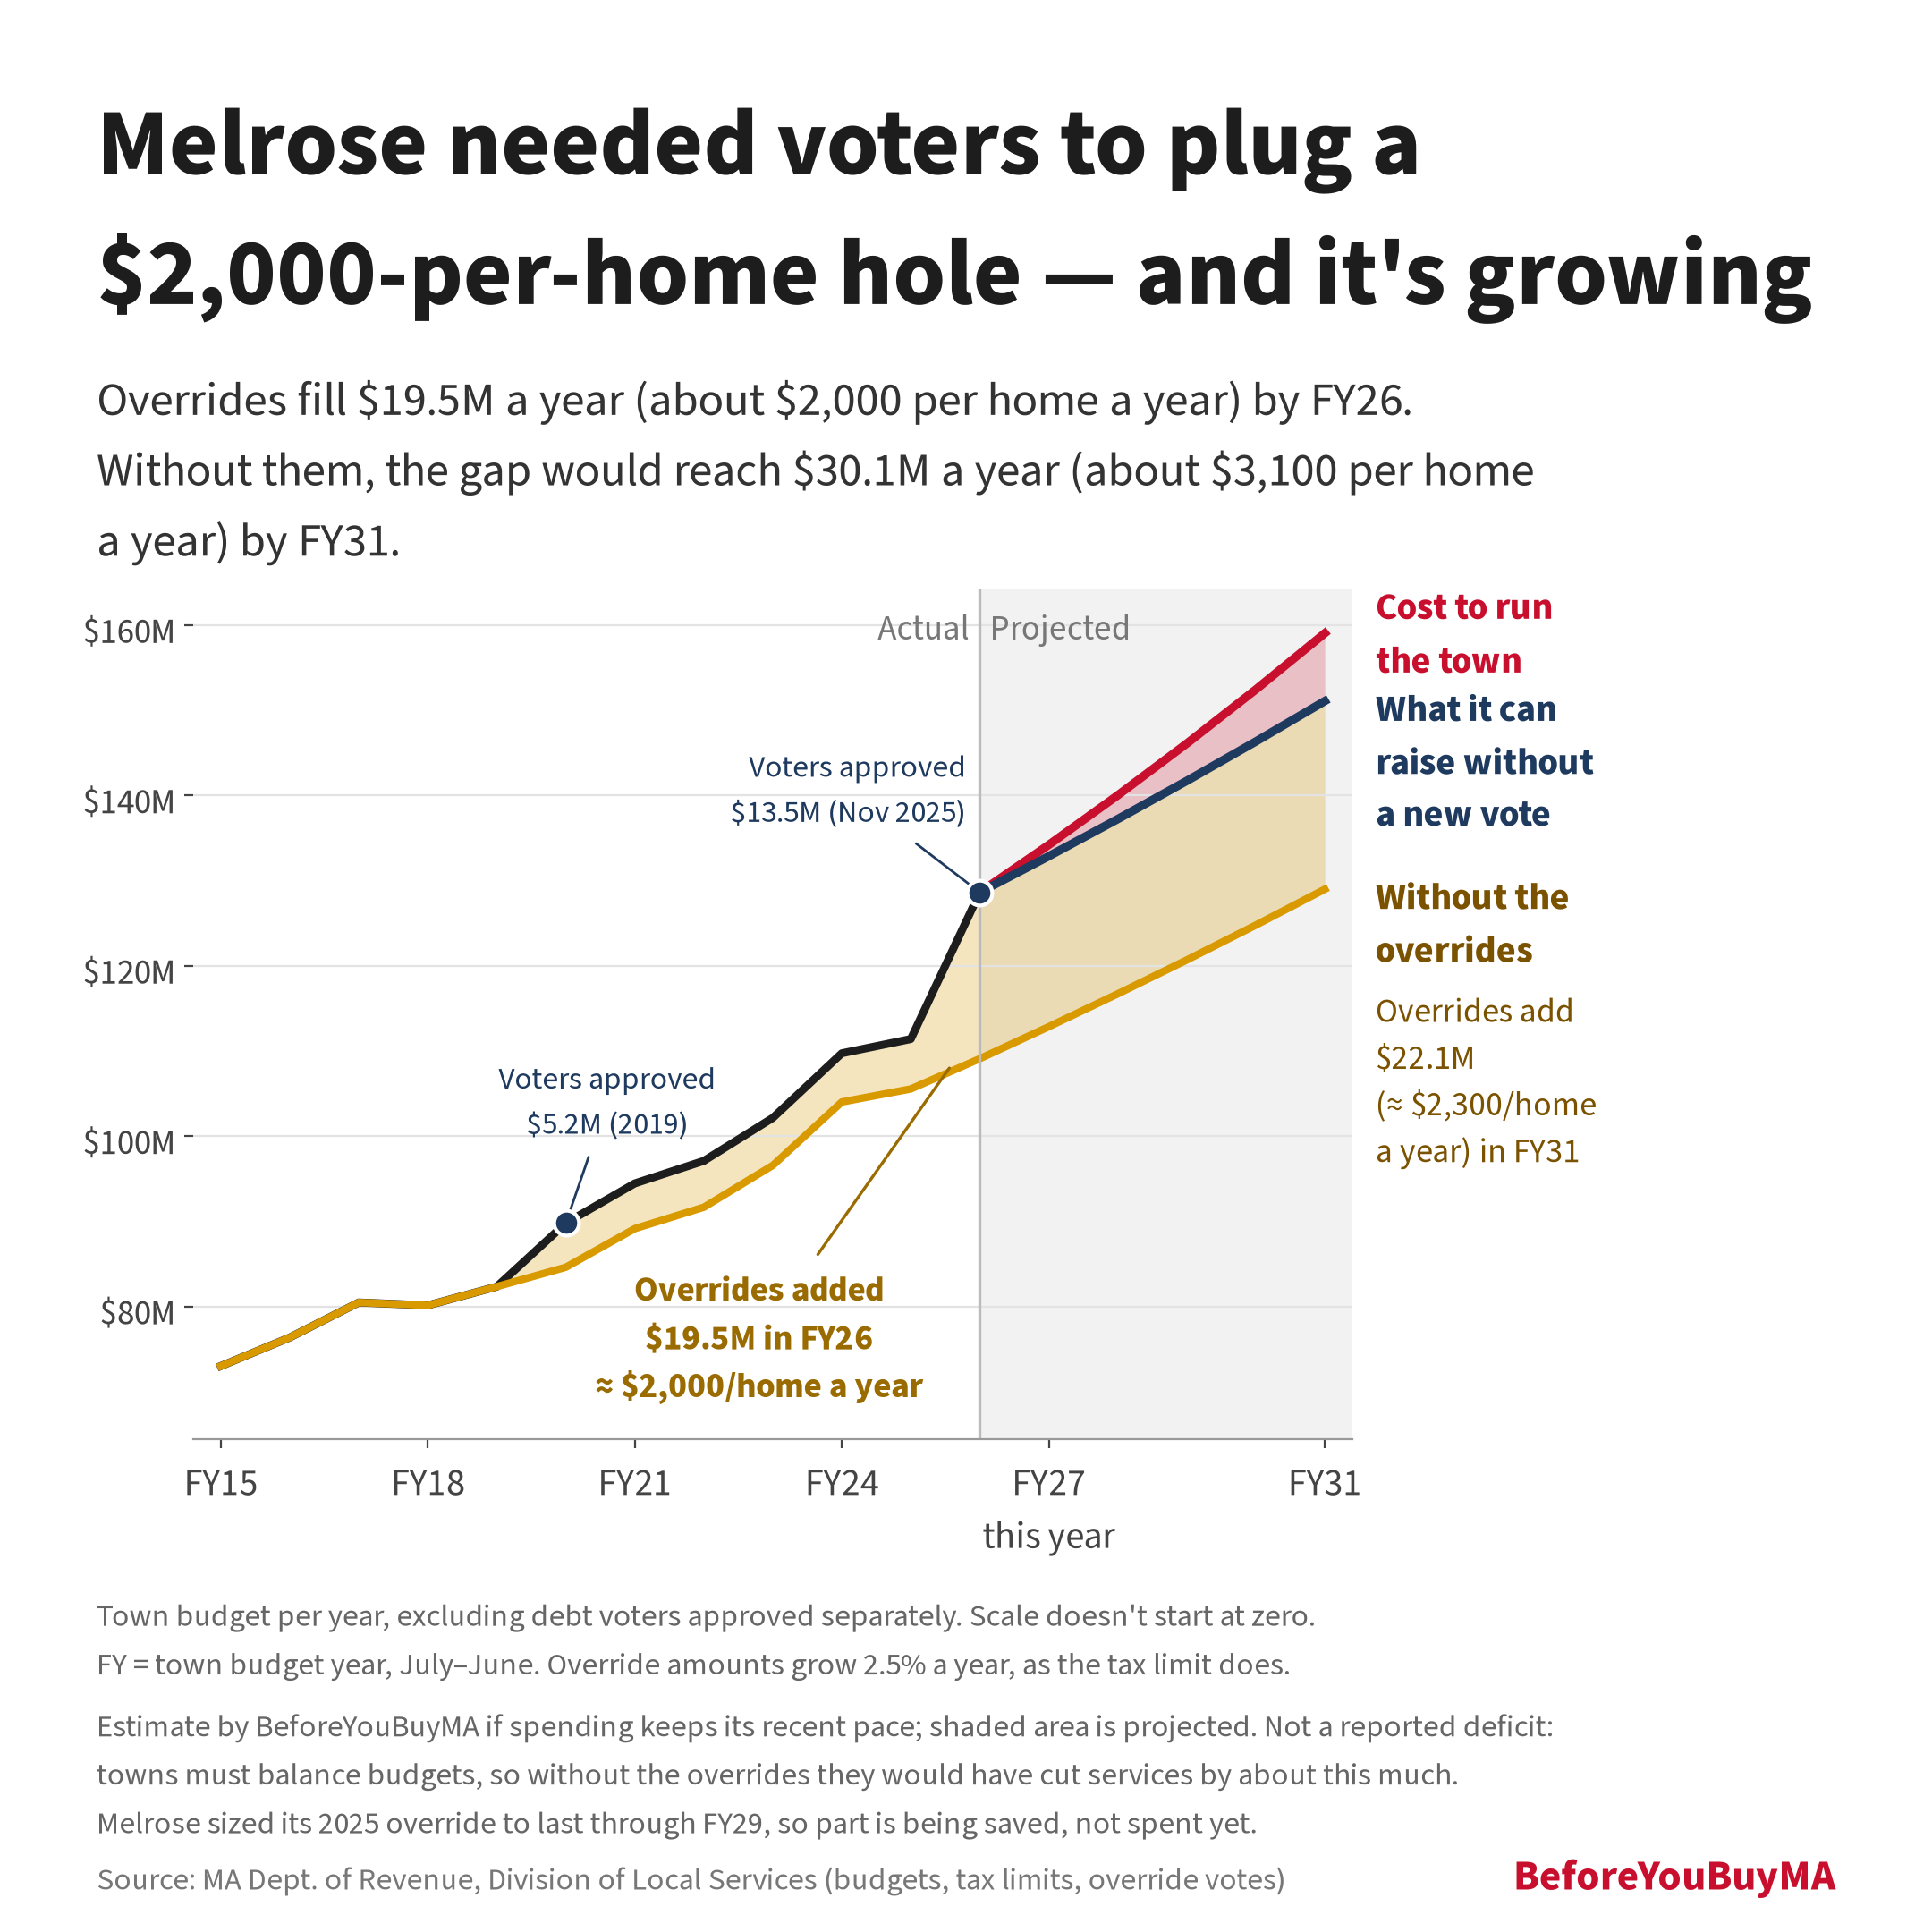
Melrose needed voters to plug a $2,000-per-home hole, and it's growing
Melrose also appears in: School budgets grew faster than 2.5% a year in all eight towns, even where students left · Cost per student rose 44–71% in seven of eight towns, while enrollment fell in six
Key numbers
| Measure | Melrose | Median MA town |
|---|---|---|
| Typical tax bill, FY2026 (average single-family) | $9,787 | $6,755 |
| Tax bill as a share of median household income | 7.3% | 6.4% |
| Tax bill growth per year, FY2016-26 | 5.47% | 3.95% |
| Override vote dates, last 5 years | Yes (2 votes, 1 failed) | 35% of towns had one |
| Savings (reserves), % of budget, FY2024-26 average | 5.0% | 7.3% |
| Debt, % of property value, FY2023-25 (voter-approved debt at half weight) | 0.57% | 0.70% |
| Debt payments inside the tax cap, % of budget | 4.1% | 1.3% |
| Unused room under the tax cap, FY2026 (% of max levy) | 0.01% | 0.34% |
| School enrollment, 5-year change | +1% | -2% |
| Students per teacher, 2025-26 | 14.3 | 11.4 |
| Median single-family sale price, 2024 | $905k (148 sales) | $614k |
| Single-family price change, 2019-24 | +37.5% | +52.8% |
| Median household income (Census, 2020-24) | $133,953 | $113,750 |
| Population (DLS) | 29,155 | 10,585 |
Main school district: Melrose. Shaded = worse than the median town on tax bill share or enrollment. Medians are across all 351 towns with data.
Why this budget grade
Budget grade C, fair (71/100; better than 26% of MA towns): reserves averaged 5% of budget over FY2024-26 (state median 7.3%); debt 0.57% of property value with voter-approved debt at half weight (0.67% before; median 0.70%); debt payments inside the tax cap 4.1% of budget (median 1.3%). 32% of debt payments are voter-approved and paid outside the cap.
Why this chance of an override vote
Chance of an override vote: High (7 pts): almost no unused room under the tax cap (0.01% of max levy, +3); override votes since July 2016, latest 2025-11 (+2); voter-approved debt or capital increase passed since July 2021 (+1); school spending grew 4.6%/yr vs 3.6%/yr for the tax cap limit, FY2020-2025 (+1).
Context, not scored
Teacher jobs -6.5% last year; enrollment +1% over 5 yrs; tax bill 7.3% of median income (state median 6.4%).
"pts" are points toward the chance of an override vote. Max levy is the most the town can raise without a vote under Prop 2½. See how the budget grade works.
Override votes since July 2016
| Vote date | Result | Amount | Purpose (as listed by DLS) |
|---|---|---|---|
| Nov 4, 2025 | Passed | $13,500,000 | Override |
| Jun 18, 2024 | Failed | $7,700,000 | Funding School,City, And Public Safety Personnel, Associated Benefits, And Services |
| Apr 2, 2019 | Passed | $5,180,000 | General Operation Of School |
Source: MA DLS Proposition 2½ override vote file, as of 25 Oct 2026. One ballot can carry several questions.
See this town in the full data table →