BeforeYouBuyMA

Home › The big picture

The big picture: why Massachusetts town budgets are squeezed

Under Proposition 2½, a Massachusetts town can raise its property tax levy by 2.5% a year, plus taxes on new construction, without asking voters. Costs, above all schools, have grown faster. These five charts show the squeeze, how towns respond, and how the wealthiest suburbs compare.

A

Town school spending is up 54% since 2015 while public school enrollment fell 4%. The tax cap allows 2.5% a year.

Mass. towns spend 54% more on schools than in 2015, for 4% fewer students
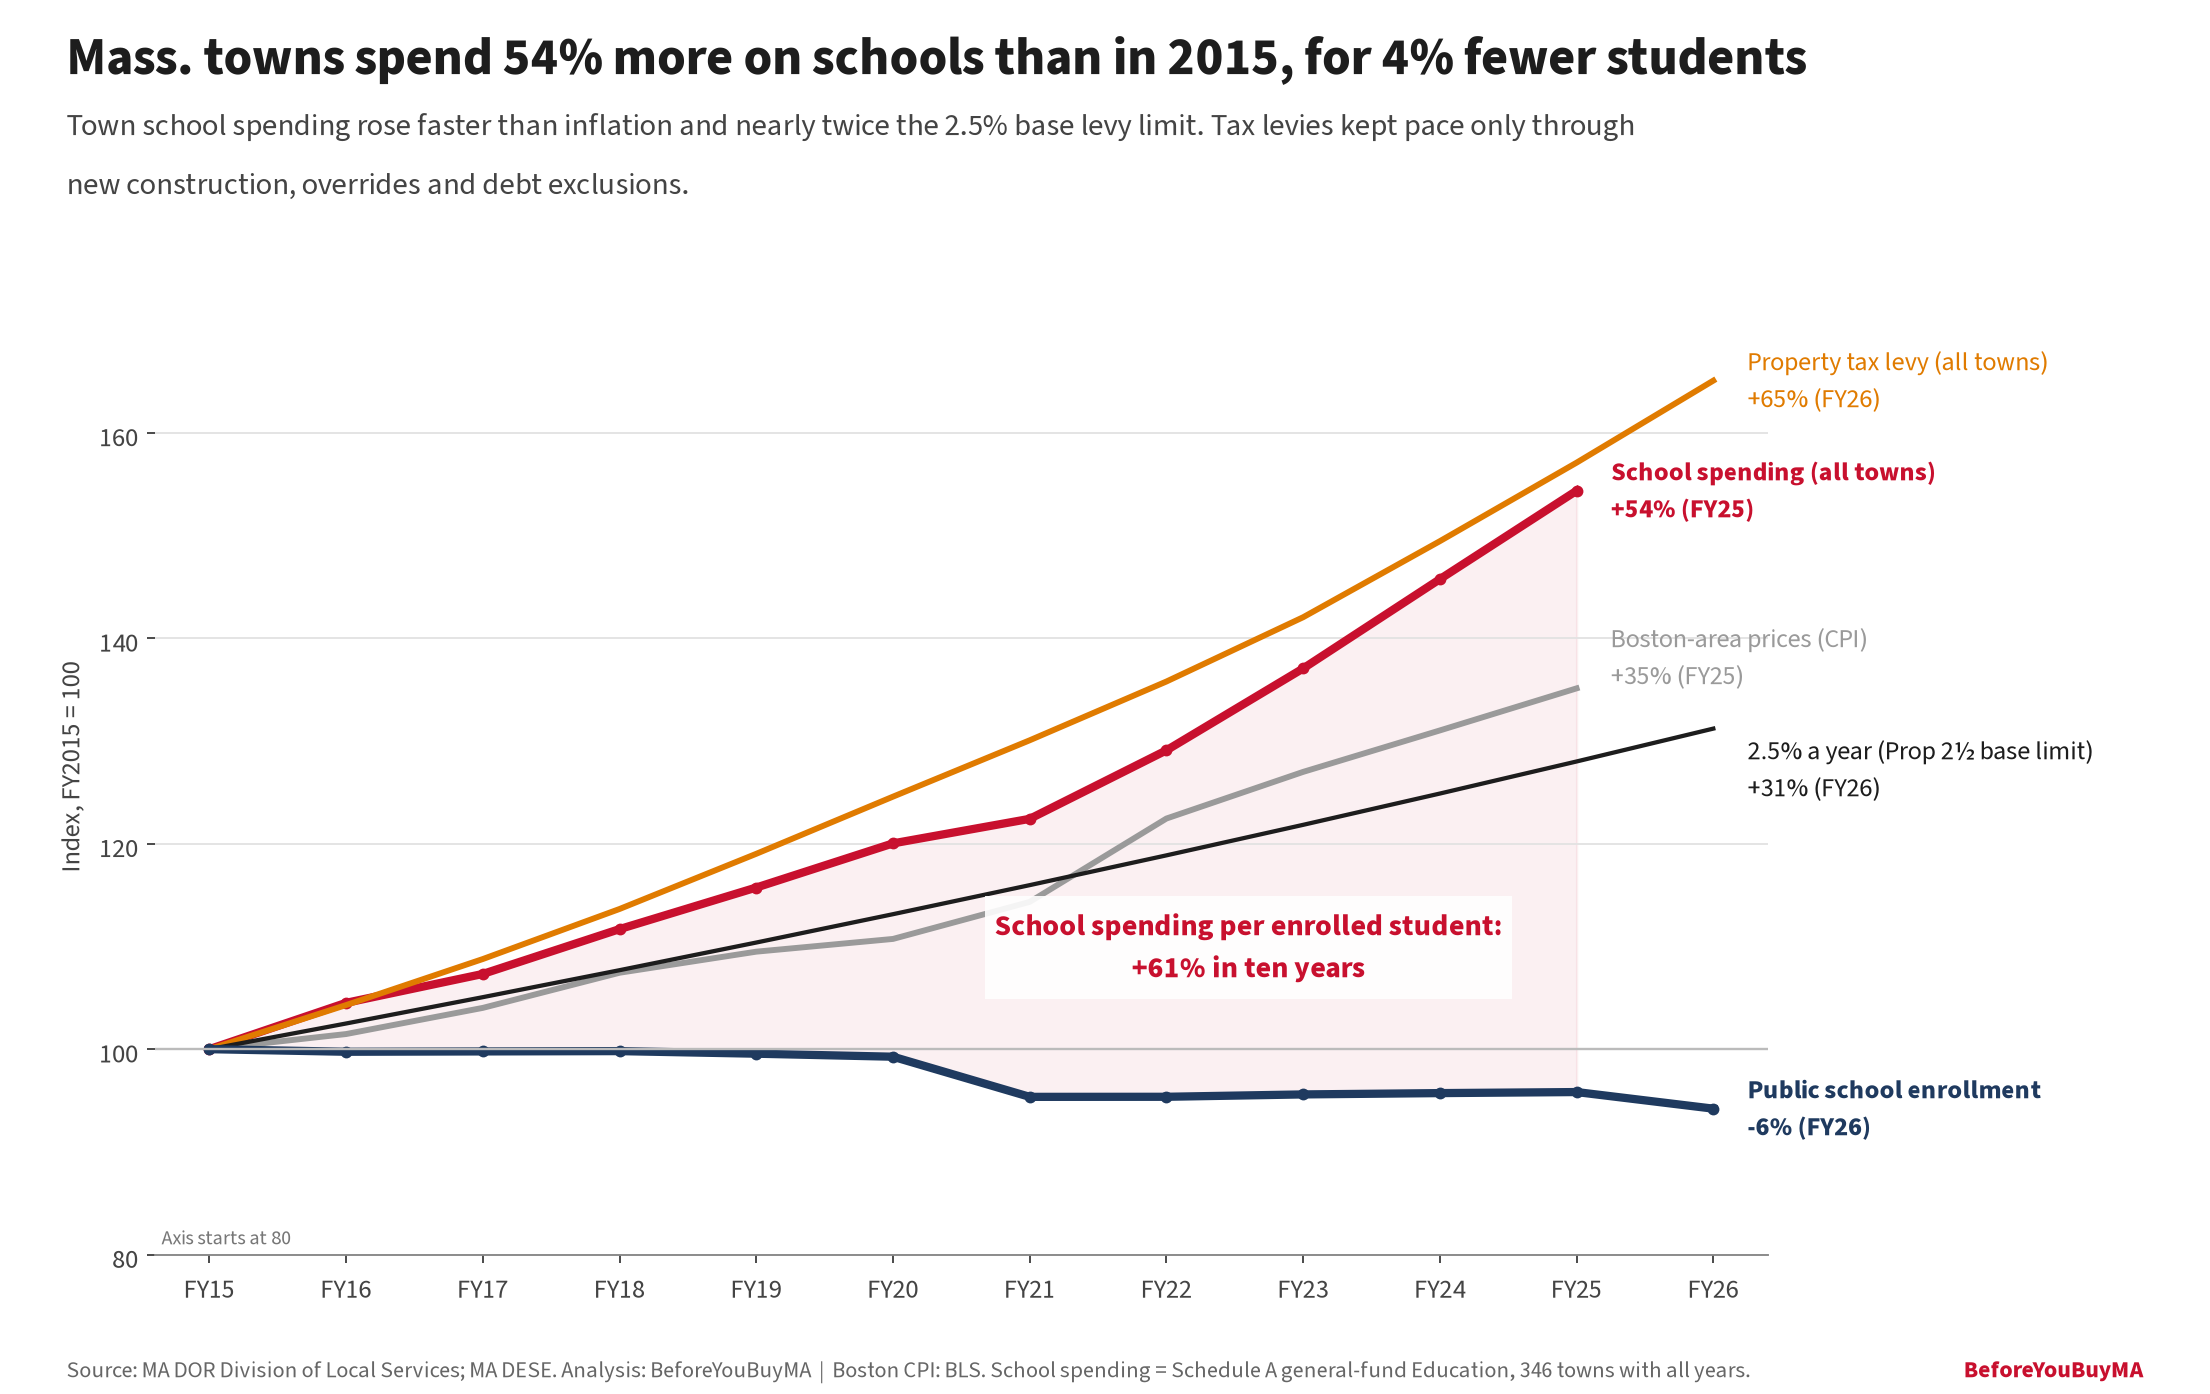
Mass. towns spend 54% more on schools than in 2015, for 4% fewer students. Town school spending rose faster than inflation and nearly twice the 2.5% base levy limit. Tax levies kept pace only through new construction, overrides and debt exclusions.
Town school spending rose faster than inflation and nearly twice the 2.5% base levy limit. Tax levies kept pace only through new construction, overrides and debt exclusions. Source: MA DLS and DESE. Click the chart to open it full size.

B

In all eight towns shown, school budgets grew faster than 2.5% a year, even where enrollment fell.

School budgets grew faster than 2.5% a year in all eight towns, even where students left
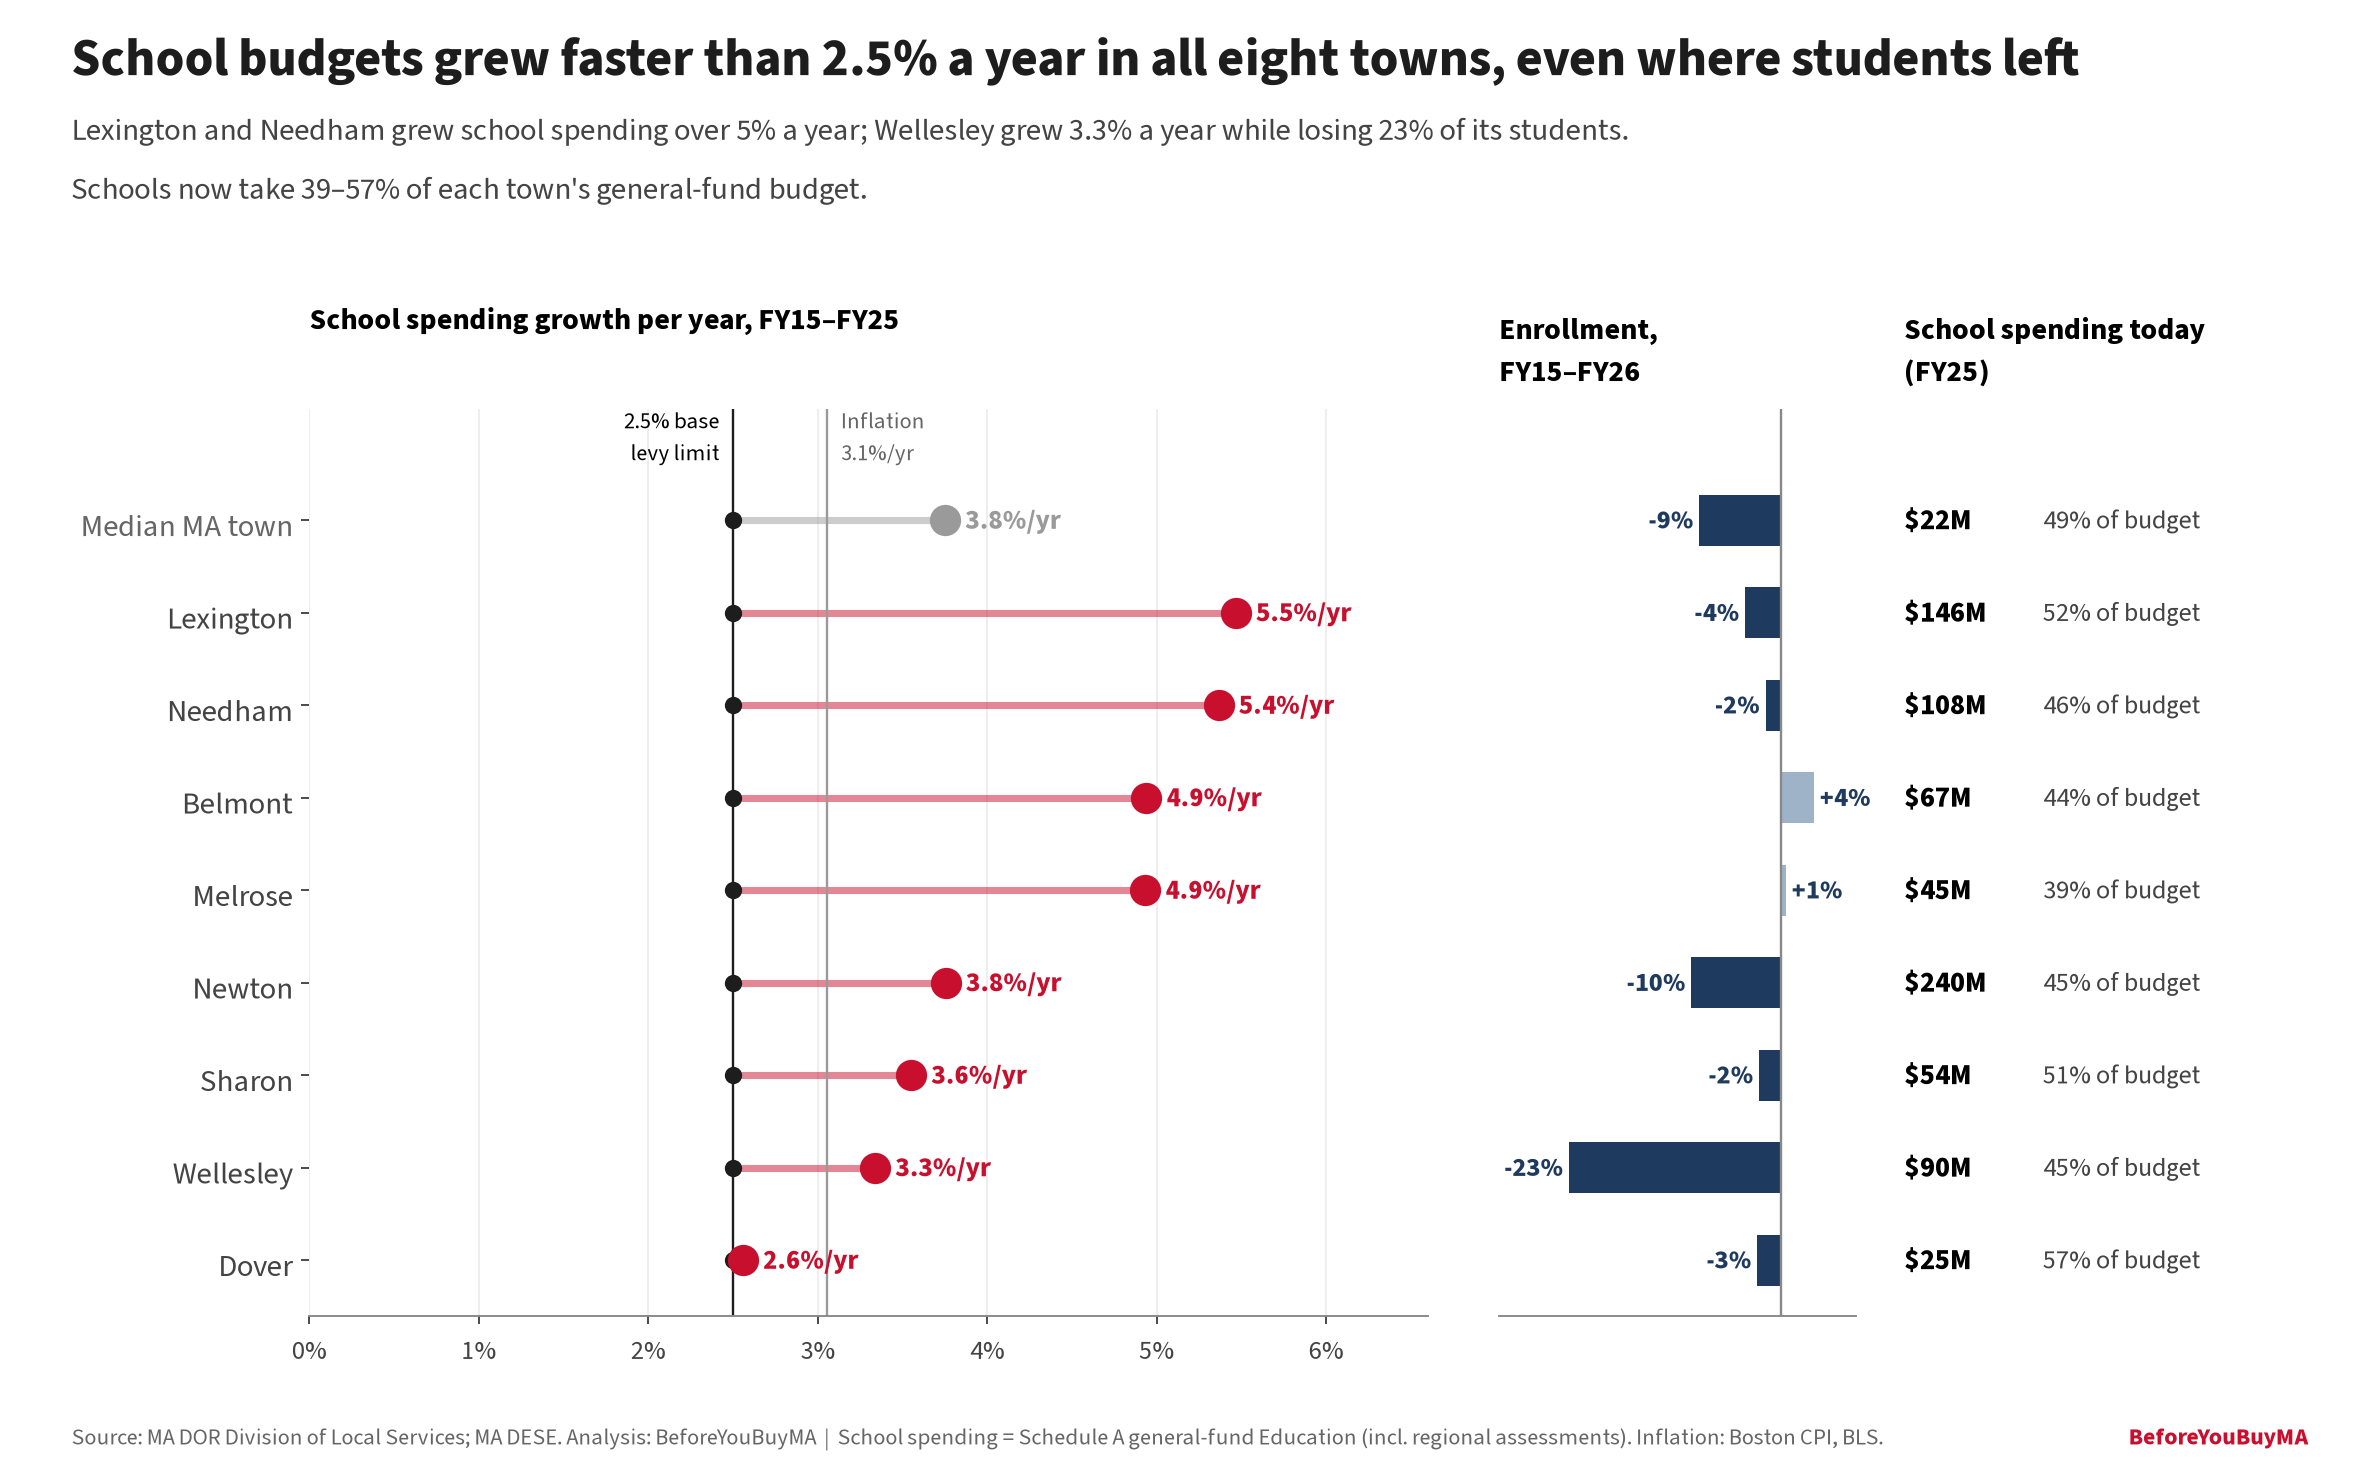
School budgets grew faster than 2.5% a year in all eight towns, even where students left. Lexington and Needham grew school spending over 5% a year; Wellesley grew 3.3% a year while losing 23% of its students. Schools now take 39–57% of each town's general-fund budget.
Lexington and Needham grew school spending over 5% a year; Wellesley grew 3.3% a year while losing 23% of its students. Schools now take 39–57% of each town's general-fund budget. Source: MA DLS and DESE. Click the chart to open it full size.

Towns in this chart: Lexington, Needham, Belmont, Melrose, Newton, Sharon, Wellesley, Dover

C

Spending per student rose 44% to 71% in seven of eight key towns, while enrollment fell in six.

Cost per student rose 44–71% in seven of eight towns, while enrollment fell in six
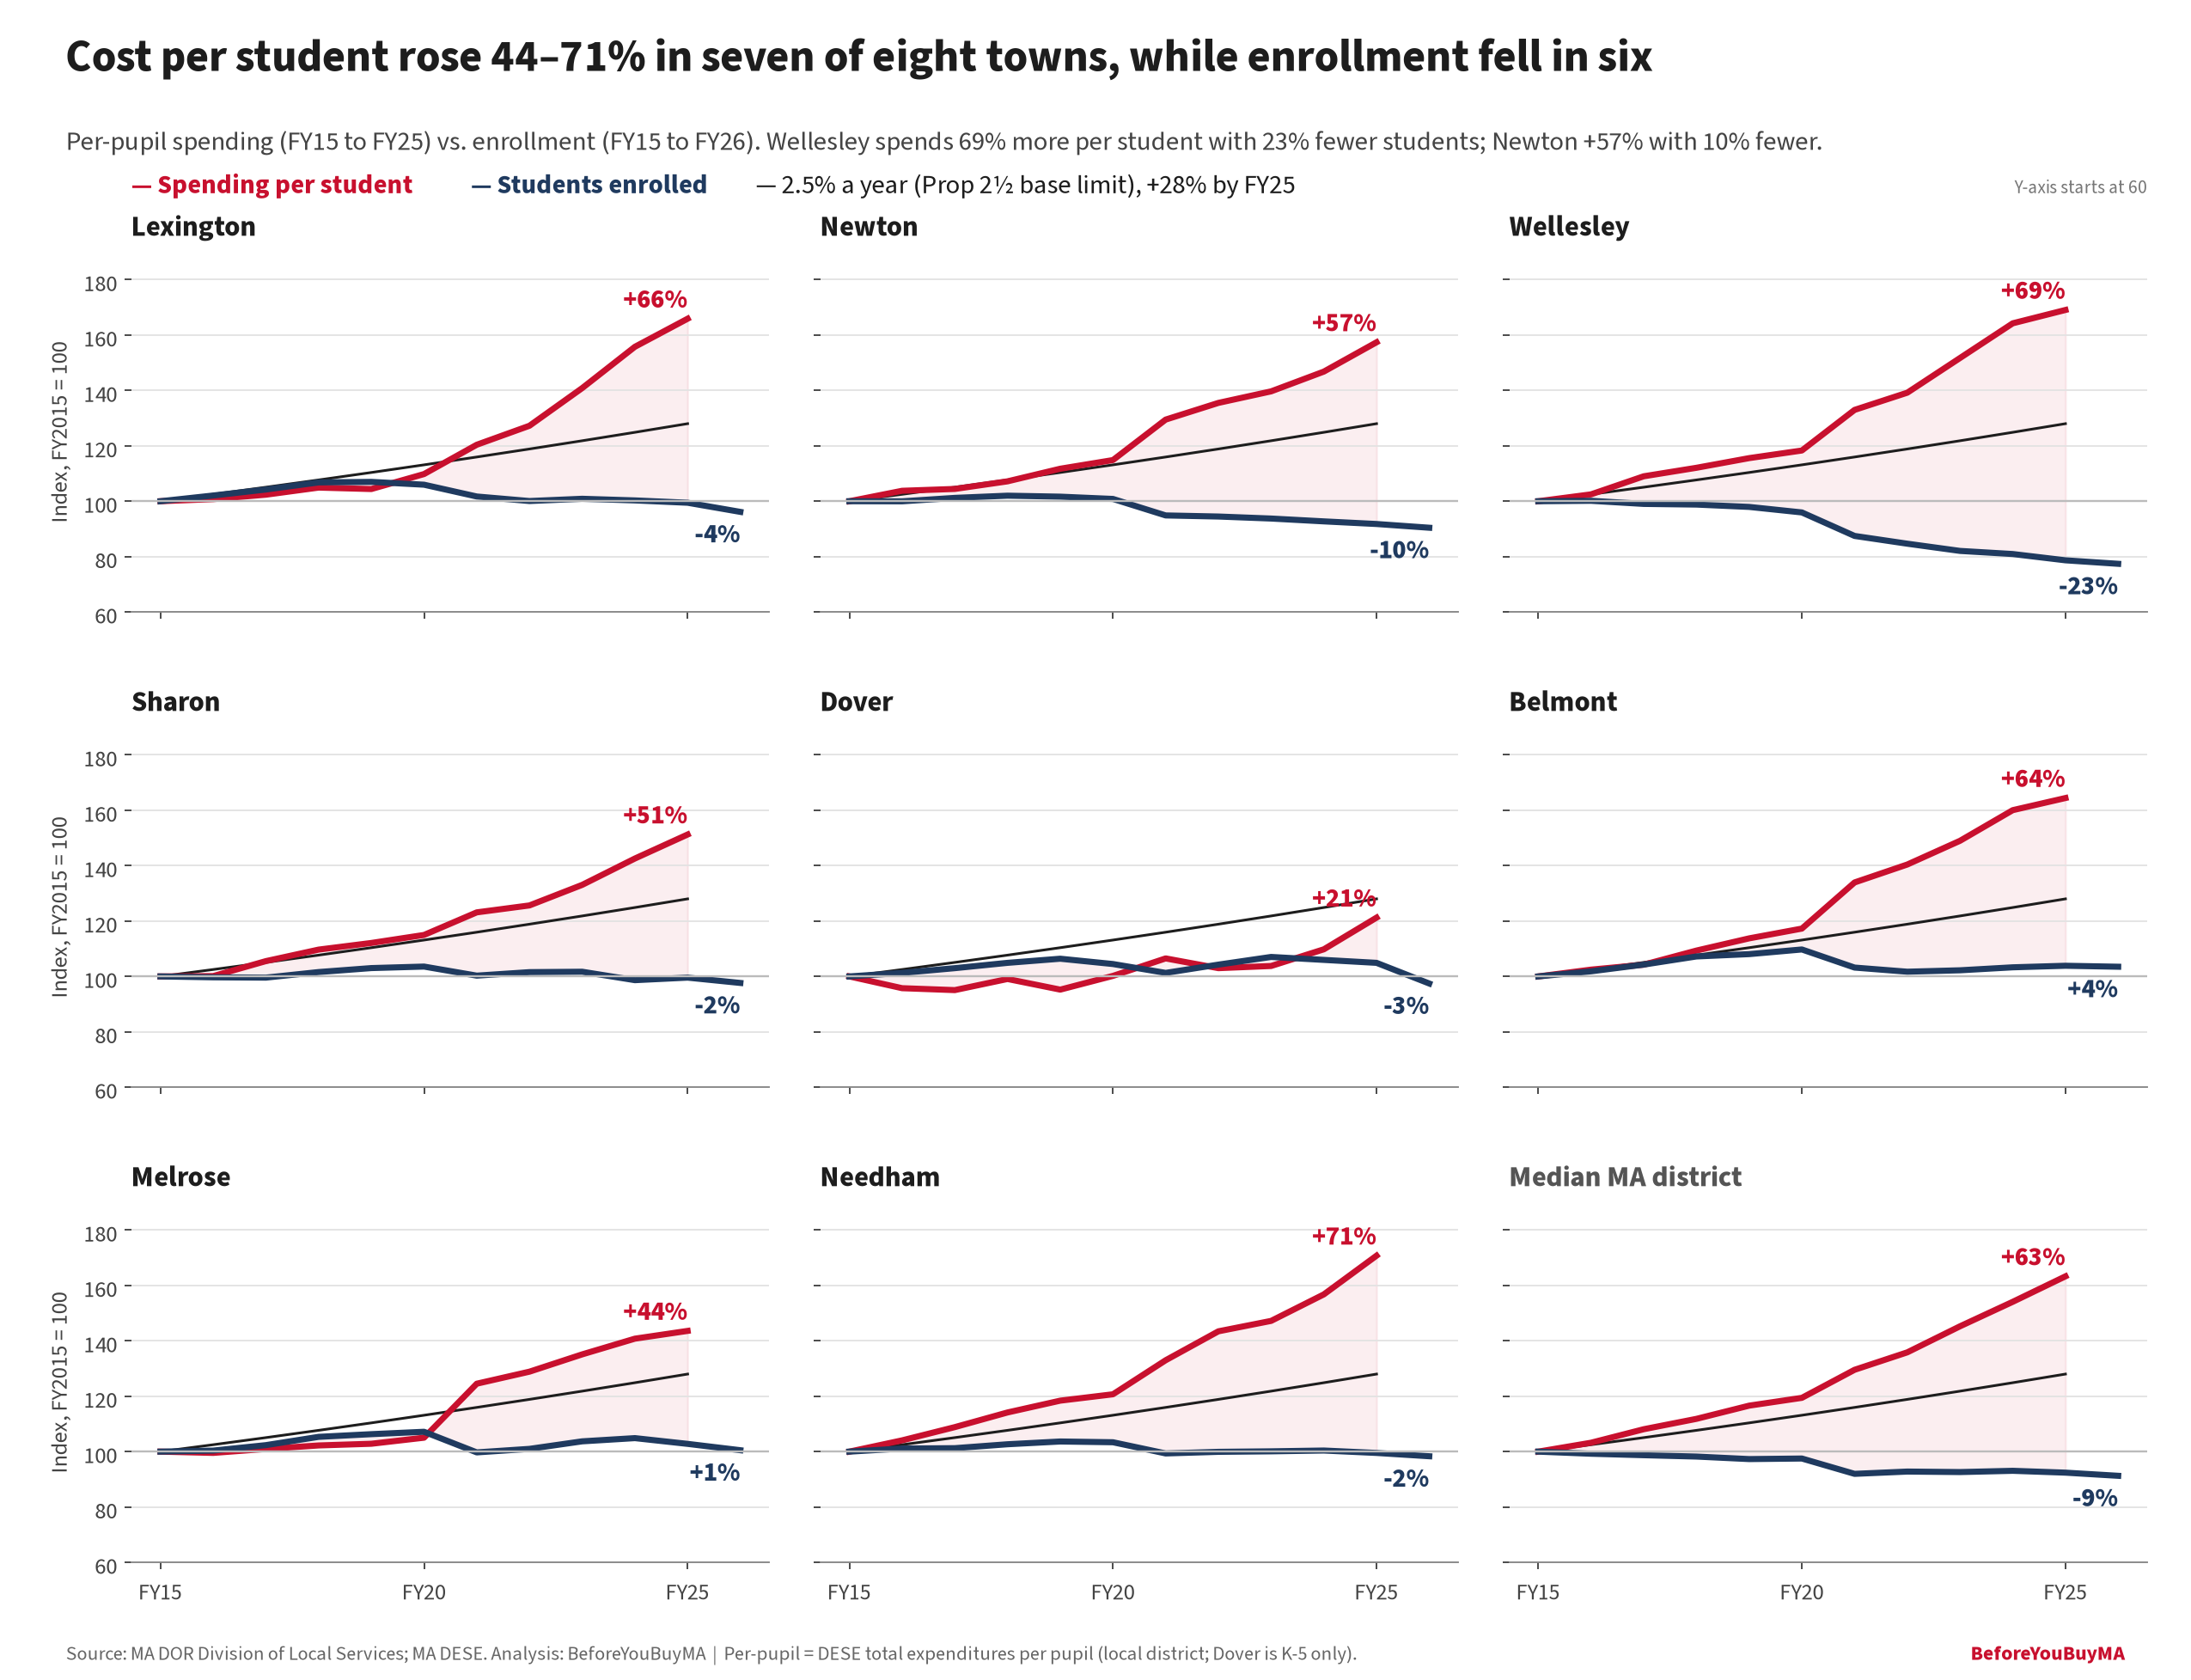
Cost per student rose 44–71% in seven of eight towns, while enrollment fell in six. Per-pupil spending (FY15 to FY25) vs. enrollment (FY15 to FY26). Wellesley spends 69% more per student with 23% fewer students; Newton +57% with 10% fewer.
Per-pupil spending (FY15 to FY25) vs. enrollment (FY15 to FY26). Wellesley spends 69% more per student with 23% fewer students; Newton +57% with 10% fewer. Source: MA DLS and DESE. Click the chart to open it full size.

Towns in this chart: Lexington, Newton, Wellesley, Sharon, Dover, Belmont, Melrose, Needham

D

Towns respond with override votes: 57 towns held one in 2026 through Sept. 28, up from 11 in 2022.

Towns holding override votes have quintupled since 2022, the most since 2008
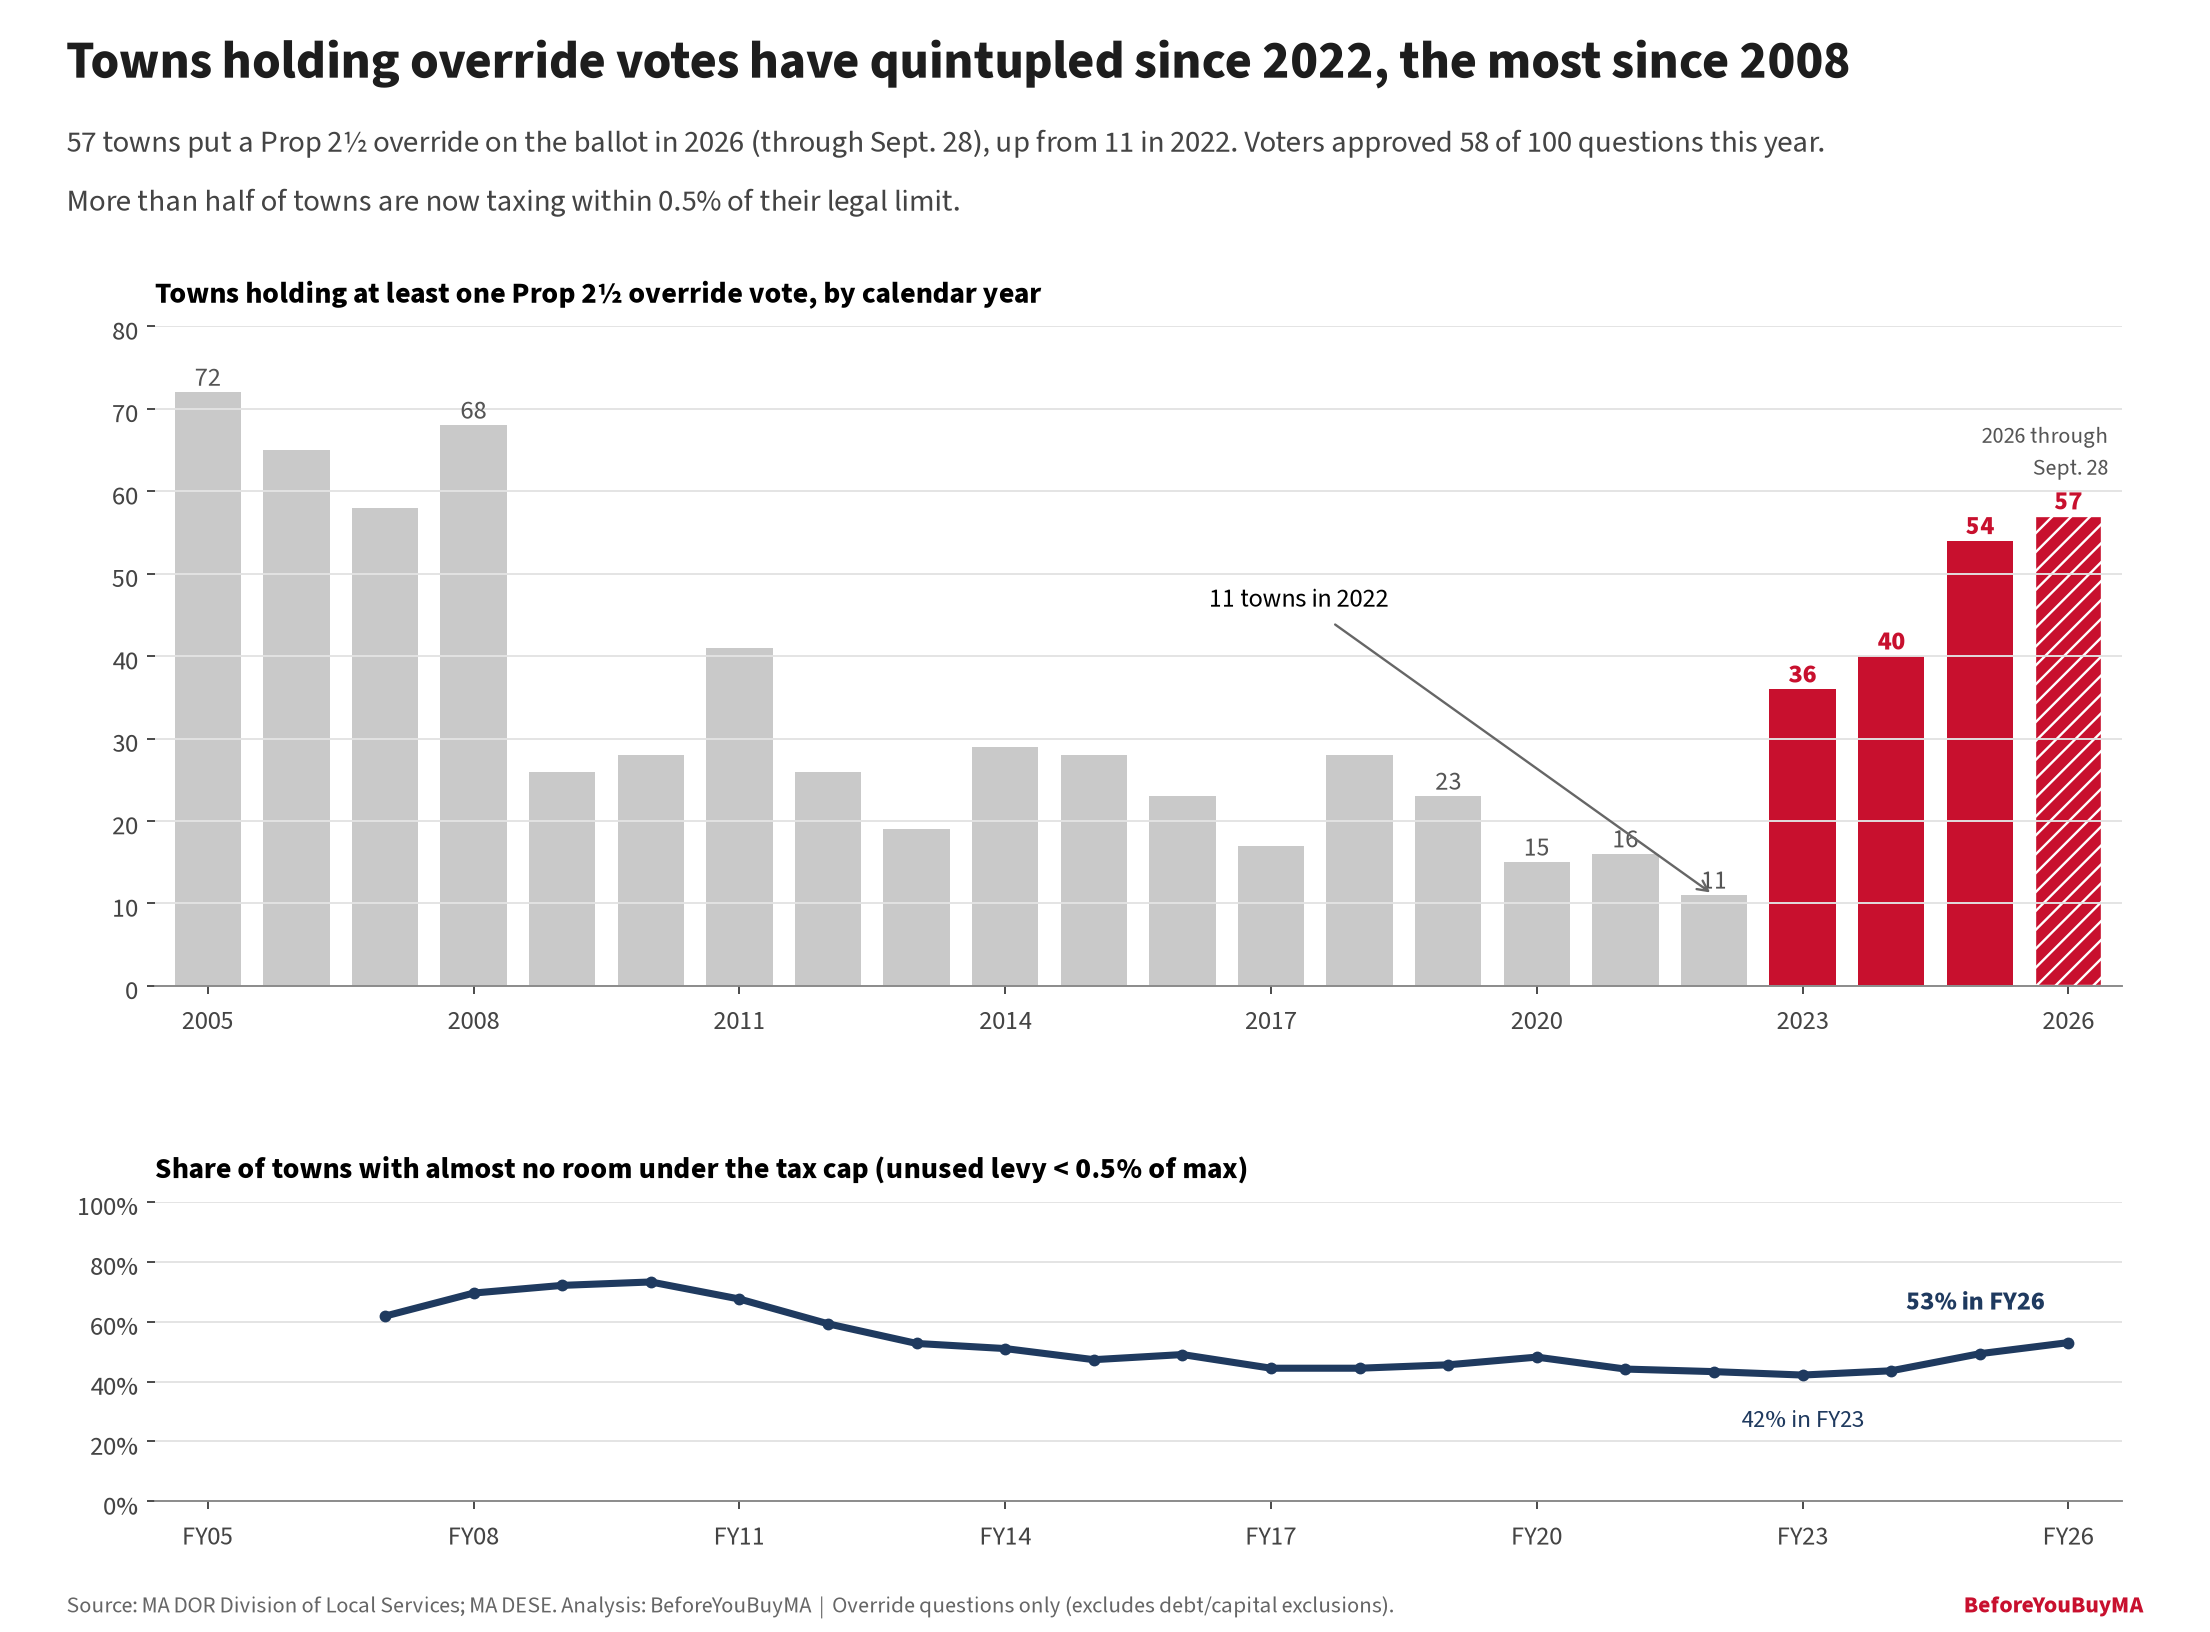
Towns holding override votes have quintupled since 2022, the most since 2008. 57 towns put a Prop 2½ override on the ballot in 2026 (through Sept. 28), up from 11 in 2022. Voters approved 58 of 100 questions this year. More than half of towns are now taxing within 0.5% of their legal limit.
57 towns put a Prop 2½ override on the ballot in 2026 (through Sept. 28), up from 11 in 2022. Voters approved 58 of 100 questions this year. More than half of towns are now taxing within 0.5% of their legal limit. Source: MA DLS and DESE. Click the chart to open it full size.

E

Even the wealthiest suburbs feel it: in all 11, tax bills outpaced prices. Concord and Westwood stand out as resilient.

The wealthiest big suburbs: fewer students, costlier schools, tax bills ahead of inflation
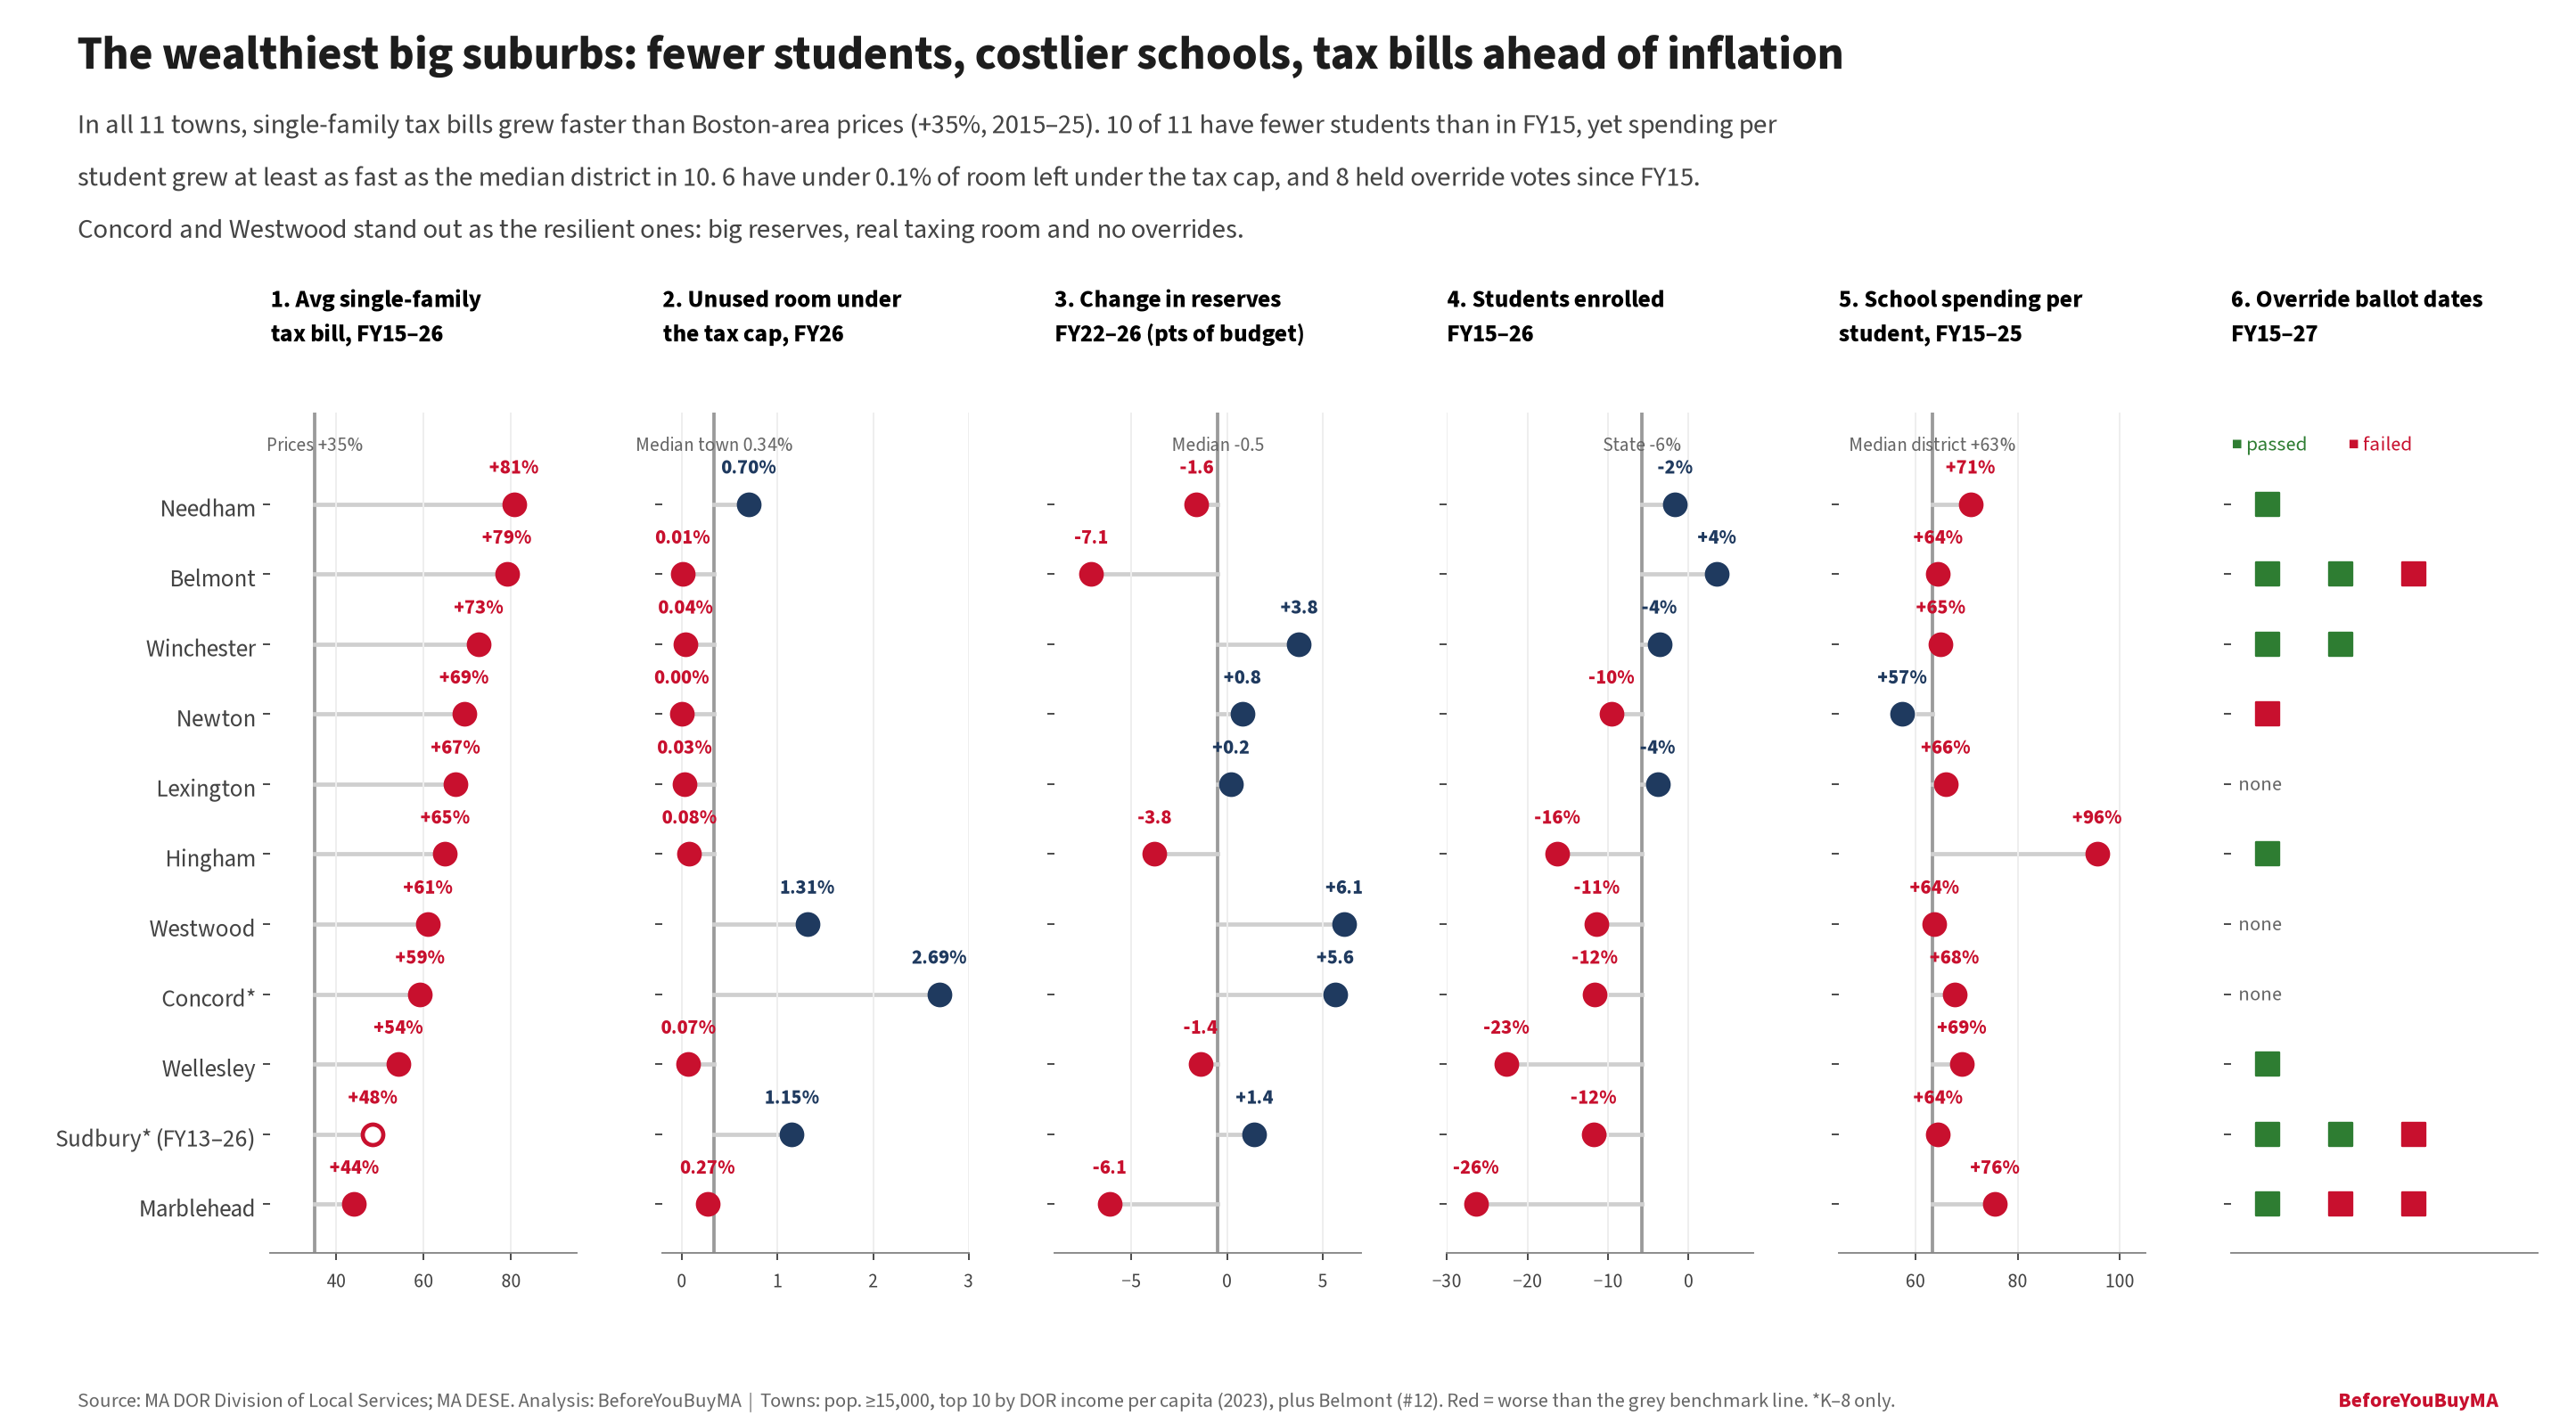
The wealthiest big suburbs: fewer students, costlier schools, tax bills ahead of inflation. In all 11 towns, single-family tax bills grew faster than Boston-area prices (+35%, 2015–25). 10 of 11 have fewer students than in FY15, yet spending per student grew at least as fast as the median district in 10. 6 have under 0.1% of room left under the tax cap, and 8 held override votes since FY15. Concord and Westwood stand out as the resilient ones: big reserves, real taxing room and no overrides.
In all 11 towns, single-family tax bills grew faster than Boston-area prices (+35%, 2015–25). 10 of 11 have fewer students than in FY15, yet spending per student grew at least as fast as the median district in 10. 6 have under 0.1% of room left under the tax cap, and 8 held override votes since FY15. Concord and Westwood stand out as the resilient ones: big reserves, real taxing room and no overrides. Source: MA DLS and DESE. Click the chart to open it full size.

Towns in this chart: Wellesley, Concord, Newton, Hingham, Lexington, Winchester, Needham, Westwood, Sudbury, Marblehead, Belmont

Towns with full chart stories

Look up your town

Every town has a budget grade, a chance of an override vote and its key numbers. Or compare all of them in the full data table.

Charts: BeforeYouBuyMA analysis of MA DOR Division of Local Services and MA DESE data; Boston-area prices from BLS. Reported figures, not estimates. Built 25 Oct 2026. How the budget grade works · Sources